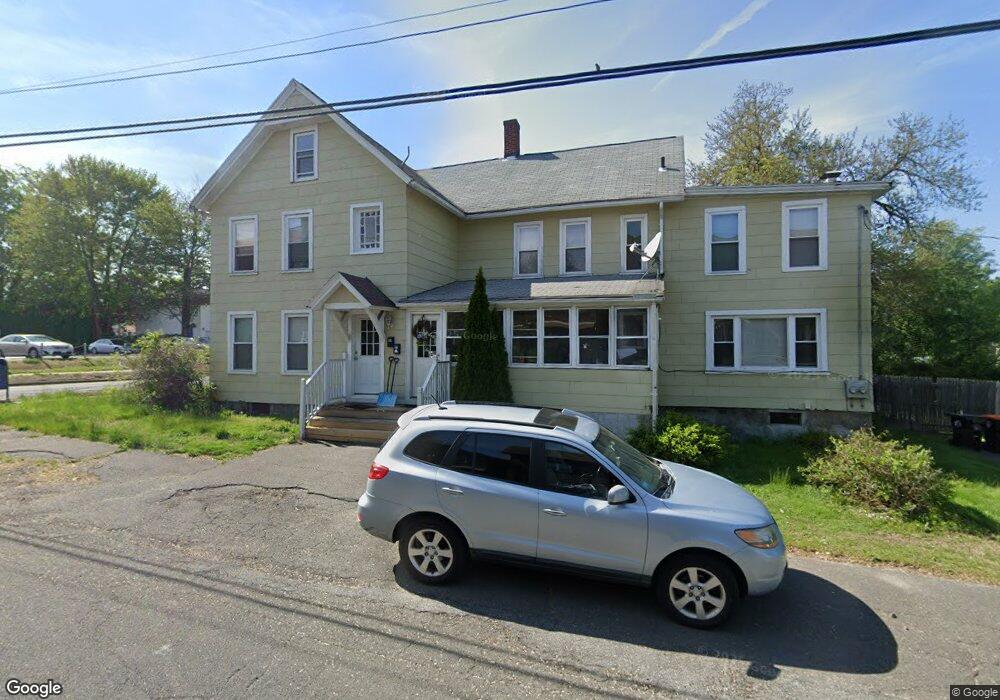
82 High St Agawam, MA 01001
Estimated Value: $375,471 - $444,000
3
Beds
1
Bath
1,300
Sq Ft
$320/Sq Ft
Est. Value
About This Home
This home is located at 82 High St, Agawam, MA 01001 and is currently estimated at $416,368, approximately $320 per square foot. 82 High St is a home located in Hampden County with nearby schools including Agawam Junior High School, Agawam High School, and St Thomas The Apostle School.
Ownership History
Date
Name
Owned For
Owner Type
Purchase Details
Closed on
Jan 25, 2021
Sold by
Gelinas Samantha
Bought by
Agawam Rentals Llc
Current Estimated Value
Home Financials for this Owner
Home Financials are based on the most recent Mortgage that was taken out on this home.
Original Mortgage
$225,000
Outstanding Balance
$201,133
Interest Rate
2.67%
Mortgage Type
Commercial
Estimated Equity
$215,235
Purchase Details
Closed on
Nov 7, 2014
Sold by
Dzhenzherukha Vitaly
Bought by
Gelinas Samantha
Home Financials for this Owner
Home Financials are based on the most recent Mortgage that was taken out on this home.
Original Mortgage
$225,834
Interest Rate
3.87%
Mortgage Type
FHA
Purchase Details
Closed on
Jun 17, 2014
Sold by
Booska Leona R
Bought by
Dzhenzherukha Vitaly
Purchase Details
Closed on
Oct 9, 2013
Sold by
Booska-Velozo Nancy L
Bought by
Booska Leona R
Purchase Details
Closed on
Feb 17, 2012
Sold by
Booska Leona R
Bought by
Booska Leona R and Booska-Velozo Nancy L
Create a Home Valuation Report for This Property
The Home Valuation Report is an in-depth analysis detailing your home's value as well as a comparison with similar homes in the area
Home Values in the Area
Average Home Value in this Area
Purchase History
| Date | Buyer | Sale Price | Title Company |
|---|---|---|---|
| Agawam Rentals Llc | $300,000 | None Available | |
| Gelinas Samantha | $230,000 | -- | |
| Dzhenzherukha Vitaly | $92,000 | -- | |
| Booska Leona R | -- | -- | |
| Booska Leona R | -- | -- |
Source: Public Records
Mortgage History
| Date | Status | Borrower | Loan Amount |
|---|---|---|---|
| Open | Agawam Rentals Llc | $225,000 | |
| Previous Owner | Gelinas Samantha | $225,834 | |
| Previous Owner | Booska Leona R | $30,000 |
Source: Public Records
Tax History Compared to Growth
Tax History
| Year | Tax Paid | Tax Assessment Tax Assessment Total Assessment is a certain percentage of the fair market value that is determined by local assessors to be the total taxable value of land and additions on the property. | Land | Improvement |
|---|---|---|---|---|
| 2025 | $5,130 | $350,400 | $98,100 | $252,300 |
| 2024 | $4,901 | $337,100 | $92,900 | $244,200 |
| 2023 | $4,499 | $285,100 | $84,900 | $200,200 |
| 2022 | $4,334 | $269,000 | $84,900 | $184,100 |
| 2021 | $4,218 | $251,100 | $72,500 | $178,600 |
| 2020 | $4,115 | $244,500 | $71,800 | $172,700 |
| 2019 | $3,976 | $238,800 | $70,200 | $168,600 |
| 2018 | $3,754 | $226,000 | $70,200 | $155,800 |
| 2017 | $3,538 | $216,900 | $70,200 | $146,700 |
| 2016 | $3,509 | $216,900 | $70,200 | $146,700 |
| 2015 | $1,571 | $99,800 | $70,200 | $29,600 |
Source: Public Records
Map
Nearby Homes
- 25 Hillcrest St
- 120 Hampden St
- 21 High St
- Lot 10 Ahiska Rd
- 456 Cold Spring Ave Unit 2A
- 30 Chestnut St
- 31 Colony Rd
- 86 York St
- 36 Maple Terrace
- 56 Exposition Terrace
- 92 Grove St
- 335-337 Springfield St
- 53 Druids Ln
- 74 Maple Terrace
- 73 Maple Terrace
- 25 Damato Way
- 138 Suffield St
- 51 Reed St
- 43 Greenleaf Ave
- 42 Janet St