82 N Grant St Wickenburg, AZ 85390
Estimated Value: $309,628 - $440,000
--
Bed
--
Bath
1,934
Sq Ft
$193/Sq Ft
Est. Value
About This Home
This home is located at 82 N Grant St, Wickenburg, AZ 85390 and is currently estimated at $374,157, approximately $193 per square foot. 82 N Grant St is a home with nearby schools including Hassayampa Elementary School, Vulture Peak Middle School, and Wickenburg High School.
Ownership History
Date
Name
Owned For
Owner Type
Purchase Details
Closed on
Apr 26, 2011
Sold by
Killoran Patrick and Killoran Sally
Bought by
Oliver Nash and Oliver Adria
Current Estimated Value
Home Financials for this Owner
Home Financials are based on the most recent Mortgage that was taken out on this home.
Original Mortgage
$134,715
Outstanding Balance
$92,928
Interest Rate
4.72%
Mortgage Type
New Conventional
Estimated Equity
$281,229
Purchase Details
Closed on
Jun 11, 2004
Sold by
Aurora Loan Services Inc
Bought by
Killoran Patrick and Killoran Sally
Home Financials for this Owner
Home Financials are based on the most recent Mortgage that was taken out on this home.
Original Mortgage
$103,000
Interest Rate
6.09%
Mortgage Type
New Conventional
Purchase Details
Closed on
May 9, 2003
Sold by
Creek H Lillian
Bought by
Aurora Loan Services Inc
Create a Home Valuation Report for This Property
The Home Valuation Report is an in-depth analysis detailing your home's value as well as a comparison with similar homes in the area
Home Values in the Area
Average Home Value in this Area
Purchase History
| Date | Buyer | Sale Price | Title Company |
|---|---|---|---|
| Oliver Nash | $130,000 | Pioneer Title Agency Inc | |
| Killoran Patrick | $130,000 | Fidelity National Title | |
| Aurora Loan Services Inc | $138,600 | -- |
Source: Public Records
Mortgage History
| Date | Status | Borrower | Loan Amount |
|---|---|---|---|
| Open | Oliver Nash | $134,715 | |
| Previous Owner | Killoran Patrick | $103,000 |
Source: Public Records
Tax History Compared to Growth
Tax History
| Year | Tax Paid | Tax Assessment Tax Assessment Total Assessment is a certain percentage of the fair market value that is determined by local assessors to be the total taxable value of land and additions on the property. | Land | Improvement |
|---|---|---|---|---|
| 2025 | $678 | $12,965 | -- | -- |
| 2024 | $670 | $12,347 | -- | -- |
| 2023 | $670 | $25,810 | $5,160 | $20,650 |
| 2022 | $670 | $17,950 | $3,590 | $14,360 |
| 2021 | $697 | $18,350 | $3,670 | $14,680 |
| 2020 | $701 | $16,010 | $3,200 | $12,810 |
| 2019 | $710 | $15,780 | $3,150 | $12,630 |
| 2018 | $702 | $13,850 | $2,770 | $11,080 |
| 2017 | $702 | $13,320 | $2,660 | $10,660 |
| 2016 | $688 | $12,950 | $2,590 | $10,360 |
| 2015 | $659 | $10,320 | $2,060 | $8,260 |
Source: Public Records
Map
Nearby Homes
- 585 S Lincoln St
- 600 Desert Canyon Rd
- 640 E Desert Canyon Rd
- 331 W Center St
- 645 Desert Canyon Rd
- 245 N Aztec Trail
- 137 N Madison St
- 101 S Mesquite St
- 0 - -- Unit 6921068
- 100 W Cottonwood Ln
- 605 Vista Ridge Ct
- 651 Chaparral
- 243 Fisher St
- 294 S Jefferson St
- 665 Chaparral
- TBD
- 621 W Wickenburg Way
- 90 W Yavapai St Unit 7
- 78 N Frontier St
- 458 N Madison St
- 72 N Grant St
- 57 N Grant St
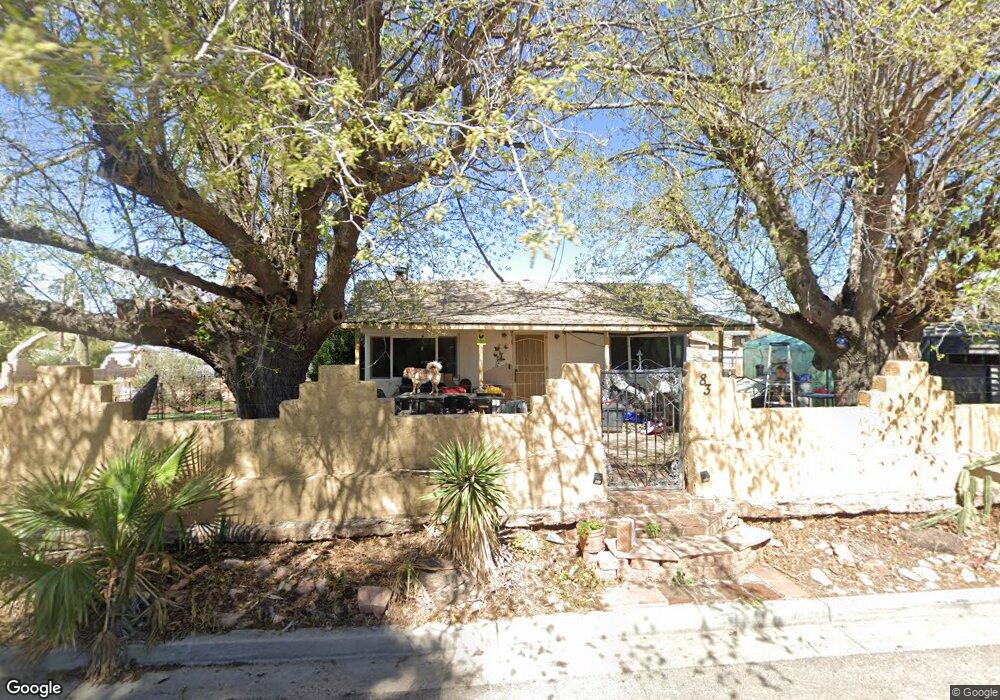
- 83 N Grant St
- 426 Kellis Rd
- 426 Kellis Rd
- 85 N Grant St
- 85 N Grant St
- 543 W Apache St
- 575 W Apache St
- 29 N Grant St
- 59 N Lincoln St
- 50 N Lincoln St
- 531 W Apache St
- 330 Lost Canyon Rd
- 512 W Apache St
- 340 Lost Canyon Rd
- 000 N Grantahm Hills Trail Unit 8H
- 0 N Grantham Rd
- 401 S Oxbow Dr
- 320 Lost Canyon Rd