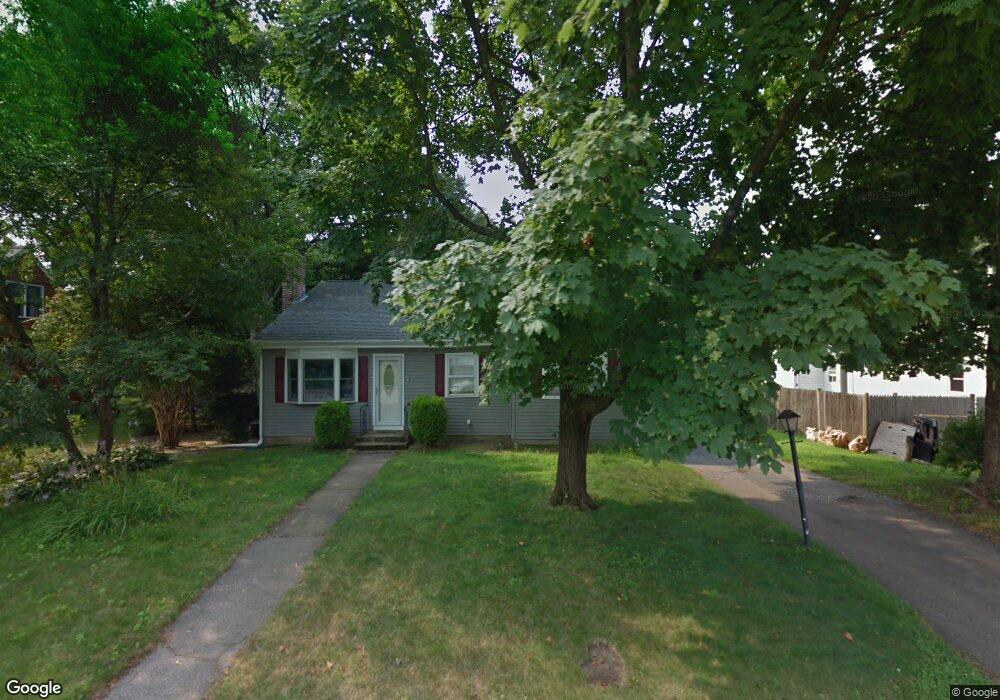
82 Nelson St Warwick, RI 02888
Lakewood NeighborhoodEstimated Value: $414,476 - $456,000
3
Beds
2
Baths
1,506
Sq Ft
$292/Sq Ft
Est. Value
About This Home
This home is located at 82 Nelson St, Warwick, RI 02888 and is currently estimated at $439,369, approximately $291 per square foot. 82 Nelson St is a home located in Kent County with nearby schools including St. Peter School and Saint Paul School.
Ownership History
Date
Name
Owned For
Owner Type
Purchase Details
Closed on
Jun 13, 2023
Sold by
Henninger Andrea
Bought by
Henninger Andrea M
Current Estimated Value
Purchase Details
Closed on
Sep 1, 2009
Sold by
Henninger Andrew J and Henninger Mary E
Bought by
Henninger Mary E
Purchase Details
Closed on
Apr 23, 1990
Sold by
Lusignan Kenneth W
Bought by
Henninger Andrew J
Create a Home Valuation Report for This Property
The Home Valuation Report is an in-depth analysis detailing your home's value as well as a comparison with similar homes in the area
Home Values in the Area
Average Home Value in this Area
Purchase History
| Date | Buyer | Sale Price | Title Company |
|---|---|---|---|
| Henninger Andrea M | -- | None Available | |
| Henninger Mary E | -- | -- | |
| Henninger Andrew J | $99,000 | -- | |
| Henninger Andrew J | $99,000 | -- |
Source: Public Records
Mortgage History
| Date | Status | Borrower | Loan Amount |
|---|---|---|---|
| Previous Owner | Henninger Andrew J | $207,872 | |
| Previous Owner | Henninger Andrew J | $80,000 | |
| Previous Owner | Henninger Andrew J | $194,400 |
Source: Public Records
Tax History Compared to Growth
Tax History
| Year | Tax Paid | Tax Assessment Tax Assessment Total Assessment is a certain percentage of the fair market value that is determined by local assessors to be the total taxable value of land and additions on the property. | Land | Improvement |
|---|---|---|---|---|
| 2025 | $5,254 | $413,700 | $101,600 | $312,100 |
| 2024 | $4,846 | $334,900 | $88,300 | $246,600 |
| 2023 | $4,752 | $334,900 | $88,300 | $246,600 |
| 2022 | $4,516 | $241,100 | $57,400 | $183,700 |
| 2021 | $4,516 | $241,100 | $57,400 | $183,700 |
| 2020 | $4,516 | $241,100 | $57,400 | $183,700 |
| 2019 | $4,516 | $241,100 | $57,400 | $183,700 |
| 2018 | $3,987 | $191,700 | $57,400 | $134,300 |
| 2017 | $3,880 | $191,700 | $57,400 | $134,300 |
| 2016 | $3,880 | $191,700 | $57,400 | $134,300 |
| 2015 | $3,864 | $186,200 | $56,400 | $129,800 |
| 2014 | $3,735 | $186,200 | $56,400 | $129,800 |
| 2013 | $3,685 | $186,200 | $56,400 | $129,800 |
Source: Public Records
Map
Nearby Homes