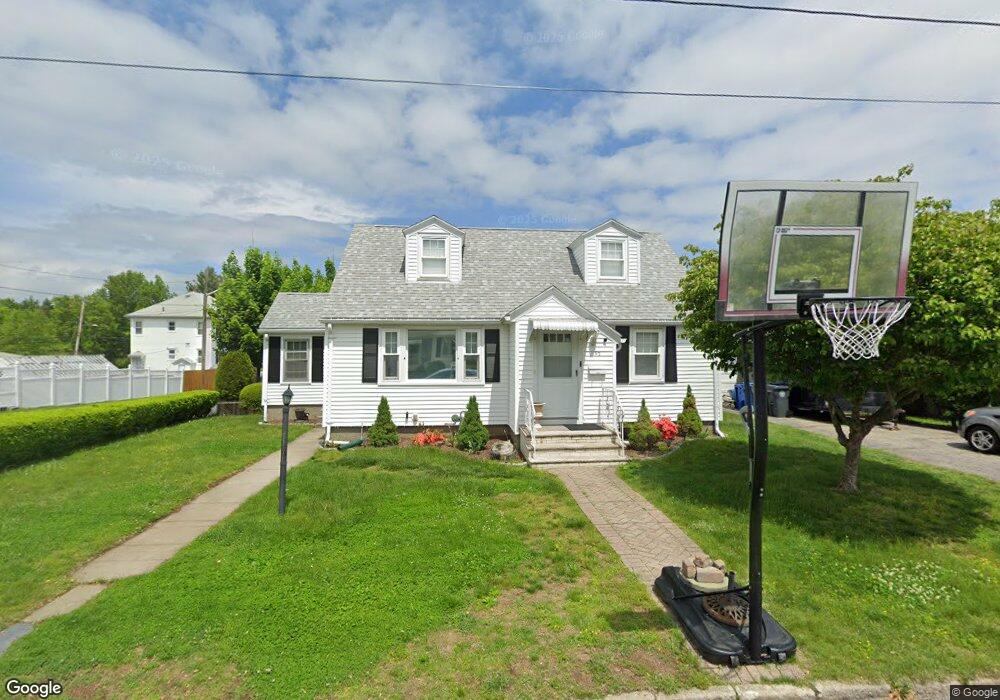
82 Tweed St Cranston, RI 02920
Thornton NeighborhoodEstimated Value: $398,690 - $497,000
4
Beds
2
Baths
1,500
Sq Ft
$293/Sq Ft
Est. Value
About This Home
This home is located at 82 Tweed St, Cranston, RI 02920 and is currently estimated at $438,923, approximately $292 per square foot. 82 Tweed St is a home located in Providence County with nearby schools including George J. Peters School, Western Hills Middle School, and Cranston High School West.
Ownership History
Date
Name
Owned For
Owner Type
Purchase Details
Closed on
Aug 4, 2021
Sold by
Loppo Lucy
Bought by
Lucy Loppo Ret
Current Estimated Value
Purchase Details
Closed on
Jul 30, 2009
Sold by
Deutsche Bank Natl T C
Bought by
Loppo Lucy and Loppo Mario
Purchase Details
Closed on
Oct 27, 2008
Sold by
Delacruz Arcelia
Bought by
Deutsche Bank Natl T C
Purchase Details
Closed on
Jul 12, 2006
Sold by
Mcmurray Frances
Bought by
Lacrus Arcelia
Home Financials for this Owner
Home Financials are based on the most recent Mortgage that was taken out on this home.
Original Mortgage
$204,000
Interest Rate
6.71%
Mortgage Type
Purchase Money Mortgage
Purchase Details
Closed on
May 29, 2002
Sold by
Anderson Michael E and Anderson Donna
Bought by
Mcmurray Frances P
Purchase Details
Closed on
Dec 16, 1996
Sold by
Iafrate Fred Louise
Bought by
Anderson Michael E
Create a Home Valuation Report for This Property
The Home Valuation Report is an in-depth analysis detailing your home's value as well as a comparison with similar homes in the area
Home Values in the Area
Average Home Value in this Area
Purchase History
| Date | Buyer | Sale Price | Title Company |
|---|---|---|---|
| Lucy Loppo Ret | -- | None Available | |
| Loppo Lucy | $125,000 | -- | |
| Deutsche Bank Natl T C | $161,500 | -- | |
| Lacrus Arcelia | $255,000 | -- | |
| Mcmurray Frances P | $148,500 | -- | |
| Anderson Michael E | $95,000 | -- |
Source: Public Records
Mortgage History
| Date | Status | Borrower | Loan Amount |
|---|---|---|---|
| Previous Owner | Anderson Michael E | $204,000 | |
| Previous Owner | Anderson Michael E | $51,000 | |
| Previous Owner | Anderson Michael E | $100,000 |
Source: Public Records
Tax History Compared to Growth
Tax History
| Year | Tax Paid | Tax Assessment Tax Assessment Total Assessment is a certain percentage of the fair market value that is determined by local assessors to be the total taxable value of land and additions on the property. | Land | Improvement |
|---|---|---|---|---|
| 2025 | $4,525 | $326,000 | $85,000 | $241,000 |
| 2024 | $4,159 | $305,600 | $85,000 | $220,600 |
| 2023 | $4,147 | $219,400 | $58,600 | $160,800 |
| 2022 | $4,061 | $219,400 | $58,600 | $160,800 |
| 2021 | $3,949 | $219,400 | $58,600 | $160,800 |
| 2020 | $3,512 | $169,100 | $45,600 | $123,500 |
| 2019 | $3,512 | $169,100 | $45,600 | $123,500 |
| 2018 | $3,431 | $169,100 | $45,600 | $123,500 |
| 2017 | $3,209 | $139,900 | $35,800 | $104,100 |
| 2016 | $3,141 | $139,900 | $35,800 | $104,100 |
| 2015 | $3,141 | $139,900 | $35,800 | $104,100 |
| 2014 | $3,220 | $141,000 | $35,800 | $105,200 |
Source: Public Records
Map
Nearby Homes
- 82 Clemence St
- 66 Clemence St
- 0 Clemence St
- 50 Clemence St Unit 50
- 30 Fletcher Ave
- 1301 Plainfield St
- 50 Tacoma St
- 70 Pocasset St
- 73 Maple Ave
- 83 Valente Dr
- 0 Plainfield Pike Unit 1374314
- 6 Vanner St
- 91 Curry Rd
- 1448 Plainfield Pike
- 25 Loomis St
- 0 Spruce St
- 1189 Plainfield St
- 16 River Dr
- 9 Baker St
- 38 Mill St