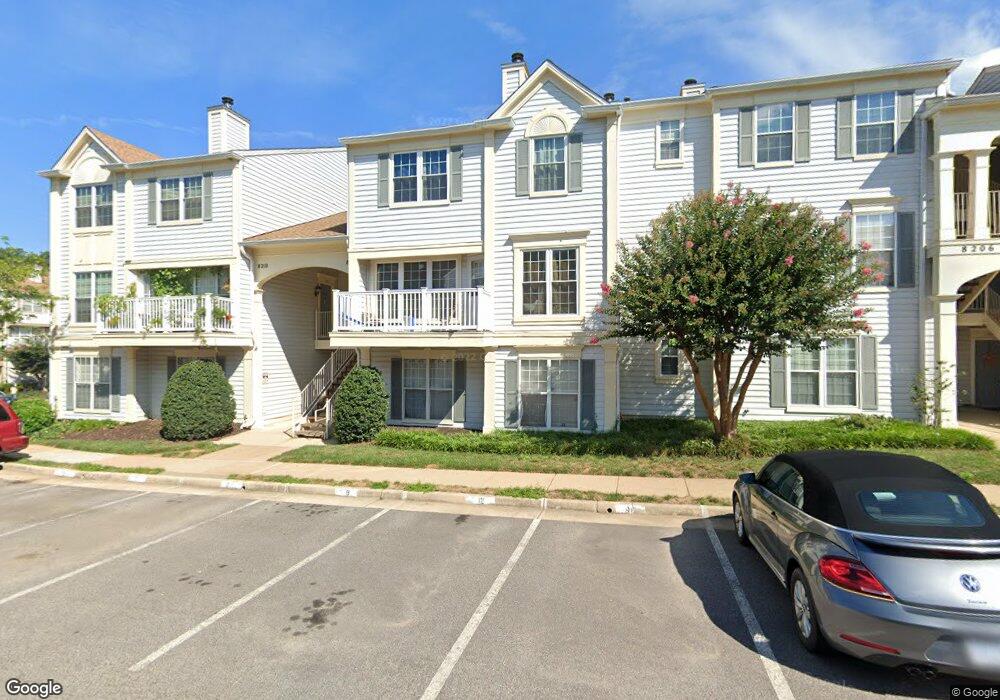
8208 Crossbrook Ct Unit 101 Lorton, VA 22079
Estimated Value: $344,583 - $385,000
2
Beds
2
Baths
1,063
Sq Ft
$345/Sq Ft
Est. Value
About This Home
This home is located at 8208 Crossbrook Ct Unit 101, Lorton, VA 22079 and is currently estimated at $367,146, approximately $345 per square foot. 8208 Crossbrook Ct Unit 101 is a home located in Fairfax County with nearby schools including Laurel Hill Elementary School, South County Middle School, and South County High School.
Ownership History
Date
Name
Owned For
Owner Type
Purchase Details
Closed on
Feb 11, 2015
Sold by
Whoolery James D
Bought by
Maciel Valerie A
Current Estimated Value
Home Financials for this Owner
Home Financials are based on the most recent Mortgage that was taken out on this home.
Original Mortgage
$204,250
Outstanding Balance
$156,792
Interest Rate
3.9%
Mortgage Type
New Conventional
Estimated Equity
$210,354
Purchase Details
Closed on
Jun 28, 2005
Sold by
Bruner Jarrod D
Bought by
Whoolery James D
Home Financials for this Owner
Home Financials are based on the most recent Mortgage that was taken out on this home.
Original Mortgage
$248,000
Interest Rate
5.73%
Mortgage Type
New Conventional
Purchase Details
Closed on
Aug 29, 2000
Sold by
Hewitt Randolph A
Bought by
Bruner Jarrod D
Home Financials for this Owner
Home Financials are based on the most recent Mortgage that was taken out on this home.
Original Mortgage
$100,470
Interest Rate
8.16%
Create a Home Valuation Report for This Property
The Home Valuation Report is an in-depth analysis detailing your home's value as well as a comparison with similar homes in the area
Home Values in the Area
Average Home Value in this Area
Purchase History
| Date | Buyer | Sale Price | Title Company |
|---|---|---|---|
| Maciel Valerie A | $215,000 | -- | |
| Whoolery James D | $310,000 | -- | |
| Bruner Jarrod D | $98,500 | -- |
Source: Public Records
Mortgage History
| Date | Status | Borrower | Loan Amount |
|---|---|---|---|
| Open | Maciel Valerie A | $204,250 | |
| Previous Owner | Whoolery James D | $248,000 | |
| Previous Owner | Bruner Jarrod D | $100,470 |
Source: Public Records
Tax History Compared to Growth
Tax History
| Year | Tax Paid | Tax Assessment Tax Assessment Total Assessment is a certain percentage of the fair market value that is determined by local assessors to be the total taxable value of land and additions on the property. | Land | Improvement |
|---|---|---|---|---|
| 2025 | $3,636 | $326,380 | $65,000 | $261,380 |
| 2024 | $3,636 | $313,830 | $63,000 | $250,830 |
| 2023 | $3,249 | $287,920 | $58,000 | $229,920 |
| 2022 | $3,077 | $269,080 | $54,000 | $215,080 |
| 2021 | $3,066 | $261,240 | $52,000 | $209,240 |
| 2020 | $2,837 | $239,670 | $48,000 | $191,670 |
| 2019 | $2,694 | $227,630 | $45,000 | $182,630 |
| 2018 | $2,545 | $221,310 | $44,000 | $177,310 |
| 2017 | $2,424 | $208,780 | $42,000 | $166,780 |
| 2016 | $2,369 | $204,510 | $41,000 | $163,510 |
| 2015 | $2,282 | $204,510 | $41,000 | $163,510 |
| 2014 | -- | $213,030 | $43,000 | $170,030 |
Source: Public Records
Map
Nearby Homes
- 8205 Crossbrook Ct Unit 201
- 9253 Cardinal Forest Ln Unit 101
- 8165 Halley Ct Unit 301
- 9257 Plaskett Ln
- 9215 Cardinal Forest Ln Unit 29
- 9220G Cardinal Forest Ln Unit 9220G
- 9220 Cardinal Forest Ln Unit E
- 9071 Power House Rd Unit 102
- 8187 Douglas Fir Dr
- 9400 Dandelion Dr
- 9407 Dandelion Dr
- 9421 Dandelion Dr
- 9410 Dandelion Dr
- 8501 Barrow Furnace Ln
- 9414 Dandelion Dr
- 9416 Dandelion Dr
- 9426 Dandelion Dr
- 9424 Dandelion Dr
- 9418 Dandelion Dr
- The Fairfax Plan at The Preserve at Lorton Valley - Townhomes
- 8206 Crossbrook Ct Unit 101
- 8210 Crossbrook Ct Unit 202
- 8210 Crossbrook Ct Unit 101
- 8202 Crossbrook Ct Unit 101
- 8202 Crossbrook Ct
- 8206 Crossbrook Ct Unit 201
- 8204 Crossbrook Ct Unit 8204C
- 8204 Crossbrook Ct Unit 301
- 8202 Crossbrook Ct Unit 201
- 8210 Crossbrook Ct Unit 8210C
- 8208 Crossbrook Ct Unit 202-C
- 8208 Crossbrook Ct Unit B
- 8202 Crossbrook Ct Unit B
- 8208 Crossbrook Ct Unit A
- 8210 Crossbrook Ct Unit 201
- 8210 Crossbrook Ct
- 8210 Crossbrook Court B Unit 201
- 8204C Crossbrook Ct Unit 301
- 8204 Crossbrook Court C Unit 301
- 8200 Crossbrook Ct