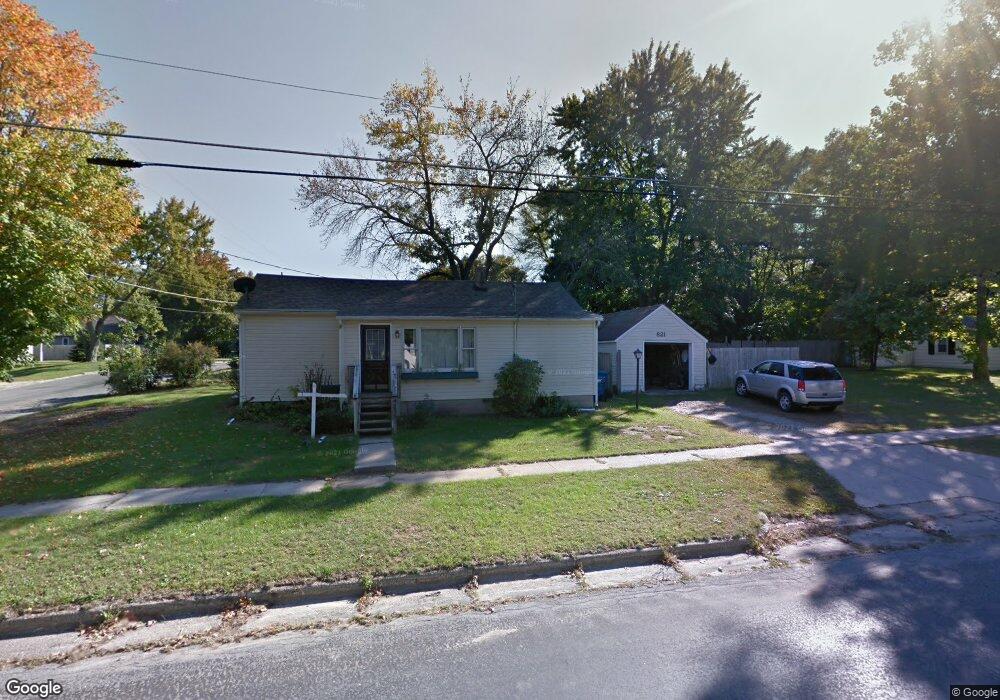
821 E Pearl St Greenville, MI 48838
Estimated Value: $162,000 - $216,334
3
Beds
1
Bath
888
Sq Ft
$210/Sq Ft
Est. Value
About This Home
This home is located at 821 E Pearl St, Greenville, MI 48838 and is currently estimated at $186,584, approximately $210 per square foot. 821 E Pearl St is a home located in Montcalm County with nearby schools including Greenville Senior High School and St. Charles Elementary School.
Ownership History
Date
Name
Owned For
Owner Type
Purchase Details
Closed on
Jan 23, 2018
Sold by
Haines Anna
Bought by
Hoven Christopher B
Current Estimated Value
Home Financials for this Owner
Home Financials are based on the most recent Mortgage that was taken out on this home.
Original Mortgage
$36,800
Outstanding Balance
$14,974
Interest Rate
3.99%
Mortgage Type
Purchase Money Mortgage
Estimated Equity
$171,610
Purchase Details
Closed on
Feb 11, 2010
Sold by
Hud
Bought by
Haines Anna M
Purchase Details
Closed on
Jul 9, 2009
Sold by
Wells Fargo Home Mortgage
Bought by
Hud
Purchase Details
Closed on
Jan 8, 2009
Sold by
Opper Corey L and Mcbride Mary B
Bought by
Wells Fargo Bank Na
Purchase Details
Closed on
Nov 15, 2002
Sold by
Myles Anthony and Myles Katrina
Bought by
Opper Corey L
Purchase Details
Closed on
Dec 31, 1996
Sold by
Bohner Daniel E
Bought by
Milner Rick
Create a Home Valuation Report for This Property
The Home Valuation Report is an in-depth analysis detailing your home's value as well as a comparison with similar homes in the area
Home Values in the Area
Average Home Value in this Area
Purchase History
| Date | Buyer | Sale Price | Title Company |
|---|---|---|---|
| Hoven Christopher B | $46,000 | -- | |
| Haines Anna M | $41,000 | -- | |
| Hud | -- | -- | |
| Wells Fargo Bank Na | $90,218 | None Available | |
| Wells Fargo Bank | $90,200 | -- | |
| Opper Corey L | $91,000 | -- | |
| Milner Rick | $59,000 | -- |
Source: Public Records
Mortgage History
| Date | Status | Borrower | Loan Amount |
|---|---|---|---|
| Open | Hoven Christopher B | $36,800 |
Source: Public Records
Tax History Compared to Growth
Tax History
| Year | Tax Paid | Tax Assessment Tax Assessment Total Assessment is a certain percentage of the fair market value that is determined by local assessors to be the total taxable value of land and additions on the property. | Land | Improvement |
|---|---|---|---|---|
| 2025 | $2,457 | $92,700 | $0 | $0 |
| 2024 | $2,431 | $85,800 | $0 | $0 |
| 2023 | -- | $76,500 | $0 | $0 |
| 2022 | -- | $63,700 | $0 | $0 |
| 2021 | -- | $57,600 | $0 | $0 |
| 2020 | -- | -- | $0 | $0 |
| 2019 | -- | -- | $0 | $0 |
| 2018 | -- | -- | $0 | $0 |
| 2017 | -- | -- | $0 | $0 |
| 2016 | -- | -- | $0 | $0 |
| 2015 | -- | -- | $0 | $0 |
| 2014 | -- | -- | $0 | $0 |
Source: Public Records
Map
Nearby Homes
- 503 E Water St
- 814 E Coffren Ave
- 408 E Market St
- 812 N 4th St
- 201 E Coffren Ave
- 120 E Montcalm St
- 726 N Lafayette St
- 301 E North St
- 203 E van Deinse St
- 210 E Washington St
- 213 W Montcalm St
- 302 W Charles St
- V/L Industrial Park Dr
- 716 E Oak St
- 215 W Grove St
- 306 W Grove St
- 615 S Webster St
- 510 W Oak Ridge
- 605 S Franklin St
- 804 S Clay St
- 813 N Burgess St
- 532 E Water St
- 532 E Water St
- 543 E Water St
- 529 E Water St
- 529 E Water St
- 621 N Walnut St
- 610 E Market St
- 518 E Water St
- 518 E Water St
- 521 E Water St
- 521 E Water St
- 528 E Market St
- 608 E Market St
- 526 E Market St
- 412 N Court St
- 524 E Market St
- 710 N Burgess St
- 508 E Water St
- 522 E Market St