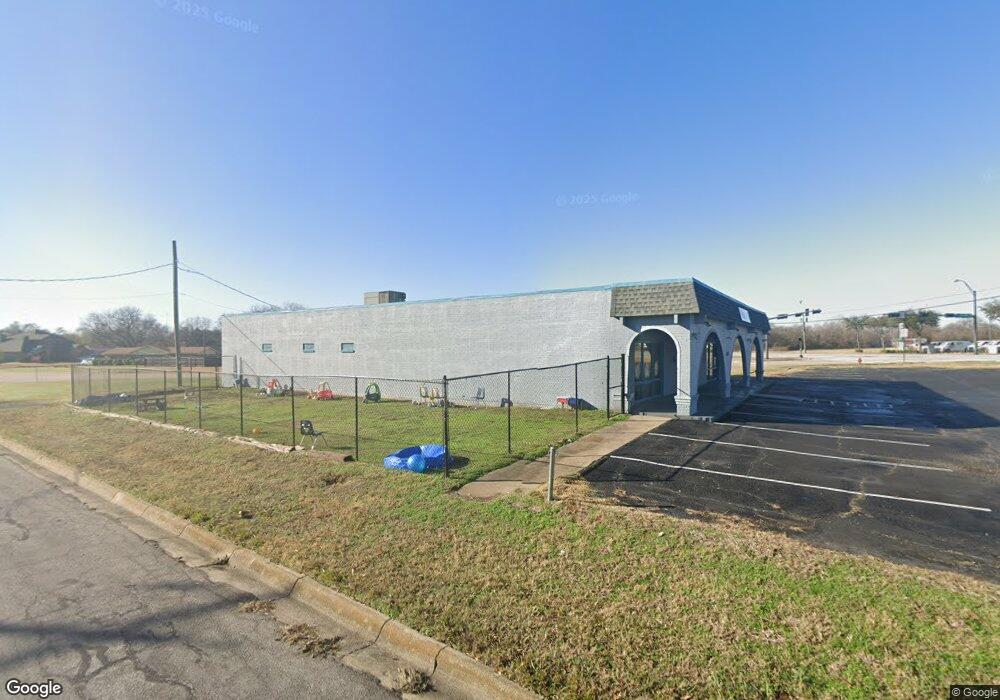
8224 Boulevard 26 North Richland Hills, TX 76180
Estimated Value: $590,299
--
Bed
--
Bath
4,960
Sq Ft
$119/Sq Ft
Est. Value
About This Home
This home is located at 8224 Boulevard 26, North Richland Hills, TX 76180 and is currently estimated at $590,299, approximately $119 per square foot. 8224 Boulevard 26 is a home located in Tarrant County with nearby schools including Jack C Binion Elementary School, Richland Middle School, and Birdville High School.
Ownership History
Date
Name
Owned For
Owner Type
Purchase Details
Closed on
Jul 11, 2019
Sold by
Southwestern Dist Of Crstn & Msny Allian
Bought by
Dfw Land Holdings Llc
Current Estimated Value
Home Financials for this Owner
Home Financials are based on the most recent Mortgage that was taken out on this home.
Original Mortgage
$232,600
Outstanding Balance
$204,112
Interest Rate
3.9%
Mortgage Type
Construction
Estimated Equity
$386,187
Purchase Details
Closed on
Aug 20, 2012
Sold by
The North Hills Alliance Church Of The S
Bought by
The Southwestern District Of The Christa
Purchase Details
Closed on
Nov 11, 1993
Sold by
Overton Bank & Trust Na
Bought by
North Hills Alliance Church Of The South
Home Financials for this Owner
Home Financials are based on the most recent Mortgage that was taken out on this home.
Original Mortgage
$115,000
Interest Rate
6.25%
Mortgage Type
Commercial
Create a Home Valuation Report for This Property
The Home Valuation Report is an in-depth analysis detailing your home's value as well as a comparison with similar homes in the area
Home Values in the Area
Average Home Value in this Area
Purchase History
| Date | Buyer | Sale Price | Title Company |
|---|---|---|---|
| Dfw Land Holdings Llc | -- | Capital Title | |
| The Southwestern District Of The Christa | -- | None Available | |
| North Hills Alliance Church Of The South | -- | Commonwealth Land Title |
Source: Public Records
Mortgage History
| Date | Status | Borrower | Loan Amount |
|---|---|---|---|
| Open | Dfw Land Holdings Llc | $232,600 | |
| Previous Owner | North Hills Alliance Church Of The South | $115,000 |
Source: Public Records
Tax History Compared to Growth
Tax History
| Year | Tax Paid | Tax Assessment Tax Assessment Total Assessment is a certain percentage of the fair market value that is determined by local assessors to be the total taxable value of land and additions on the property. | Land | Improvement |
|---|---|---|---|---|
| 2025 | $14,950 | $582,071 | $250,992 | $331,079 |
| 2024 | $14,950 | $720,047 | $250,992 | $469,055 |
| 2023 | $16,527 | $753,379 | $250,992 | $502,387 |
| 2022 | $15,469 | $642,851 | $250,992 | $391,859 |
| 2021 | $6,362 | $250,000 | $245,000 | $5,000 |
| 2020 | $15,110 | $593,811 | $250,992 | $342,819 |
| 2019 | $7,045 | $579,550 | $246,352 | $333,198 |
| 2018 | $0 | $559,472 | $246,352 | $313,120 |
| 2017 | $13,301 | $494,377 | $153,970 | $340,407 |
| 2016 | $13,336 | $495,681 | $246,352 | $249,329 |
| 2015 | -- | $495,681 | $246,352 | $249,329 |
| 2014 | -- | $495,681 | $246,352 | $249,329 |
Source: Public Records
Map
Nearby Homes
- 5304 Colorado Blvd
- 5016 Wyoming Trail
- 5020 Colorado Blvd
- 5113 Bob Dr
- 8020 Laura St
- 8417 Emerald Cir
- 8304 Emerald Cir
- 7908 Lazy Lane Rd
- 5336 Davis Blvd
- 7717 Janetta Dr
- 1230 Wooded Trail
- 1230 Woodland Park Dr
- 1218 Wooded Trail
- 7821 Davis Blvd
- 1220 Woodland Park Dr
- 5801 Winter Park Dr
- 5320 Topper Dr
- 823 W Harwood Rd
- 7800 Mockingbird Ln Unit 29
- 7800 Mockingbird Ln Unit 81
- 5125 Pearl Dr
- 5121 Pearl Dr
- 5113 Pearl Dr
- 8208 Boulevard 26
- 5109 Pearl Dr
- 5132 Pearl Dr
- 5128 Pearl Dr
- 5105 Pearl Dr
- 5124 Pearl Dr
- 8213 Jerrie jo Dr
- 5149 Jennings Dr
- 5145 Jennings Dr
- 8209 Jerrie jo Dr
- 5101 Pearl Dr
- 5108 Pearl Dr
- 5104 Pearl Dr
- 5112 Pearl Dr
- 5122 Pearl Dr
- 5141 Jennings Dr
- 5120 Pearl Dr