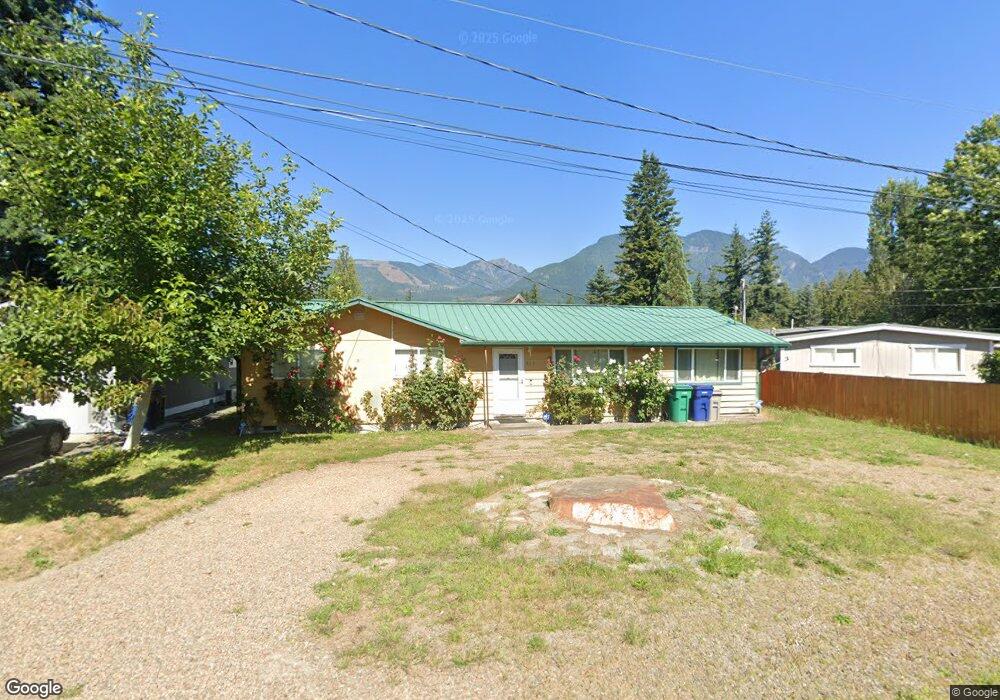
823 Orchard Ave Gold Bar, WA 98251
Estimated Value: $456,000 - $510,000
3
Beds
1
Bath
1,380
Sq Ft
$351/Sq Ft
Est. Value
About This Home
This home is located at 823 Orchard Ave, Gold Bar, WA 98251 and is currently estimated at $483,954, approximately $350 per square foot. 823 Orchard Ave is a home located in Snohomish County with nearby schools including Sultan Senior High School.
Ownership History
Date
Name
Owned For
Owner Type
Purchase Details
Closed on
Apr 6, 2004
Sold by
Chase Manhattan Mortgage Corp
Bought by
Seagra Martin
Current Estimated Value
Home Financials for this Owner
Home Financials are based on the most recent Mortgage that was taken out on this home.
Original Mortgage
$119,600
Interest Rate
5.7%
Mortgage Type
Purchase Money Mortgage
Purchase Details
Closed on
Jan 29, 2004
Sold by
Griffin Dale R
Bought by
Chase Manhattan Mortgage Corp
Purchase Details
Closed on
Mar 18, 1998
Sold by
Markley Garey L and Markley Prudence
Bought by
Griffin Dale R
Home Financials for this Owner
Home Financials are based on the most recent Mortgage that was taken out on this home.
Original Mortgage
$104,802
Interest Rate
7.02%
Mortgage Type
FHA
Create a Home Valuation Report for This Property
The Home Valuation Report is an in-depth analysis detailing your home's value as well as a comparison with similar homes in the area
Home Values in the Area
Average Home Value in this Area
Purchase History
| Date | Buyer | Sale Price | Title Company |
|---|---|---|---|
| Seagra Martin | $149,500 | First American | |
| Chase Manhattan Mortgage Corp | $116,701 | First American | |
| Griffin Dale R | $104,802 | -- |
Source: Public Records
Mortgage History
| Date | Status | Borrower | Loan Amount |
|---|---|---|---|
| Open | Seagran Martin A | $166,000 | |
| Closed | Seagran Martin | $100,000 | |
| Closed | Seagran Martin | $209,686 | |
| Closed | Seagran Martin | $192,095 | |
| Closed | Seagran Martin | $56,234 | |
| Closed | Seagra Martin | $119,600 | |
| Previous Owner | Griffin Dale R | $104,802 | |
| Closed | Seagra Martin | $29,900 |
Source: Public Records
Tax History Compared to Growth
Tax History
| Year | Tax Paid | Tax Assessment Tax Assessment Total Assessment is a certain percentage of the fair market value that is determined by local assessors to be the total taxable value of land and additions on the property. | Land | Improvement |
|---|---|---|---|---|
| 2025 | $3,389 | $397,000 | $197,000 | $200,000 |
| 2024 | $3,125 | $370,400 | $177,000 | $193,400 |
| 2023 | $3,122 | $411,900 | $209,000 | $202,900 |
| 2022 | $2,713 | $312,500 | $145,000 | $167,500 |
| 2020 | $2,349 | $255,400 | $110,000 | $145,400 |
| 2019 | $2,167 | $233,500 | $93,000 | $140,500 |
| 2018 | $2,442 | $210,500 | $78,000 | $132,500 |
| 2017 | $1,820 | $157,400 | $54,000 | $103,400 |
| 2016 | $1,708 | $141,400 | $41,000 | $100,400 |
| 2015 | $754 | $118,700 | $34,000 | $84,700 |
| 2013 | $1,501 | $110,000 | $34,000 | $76,000 |
Source: Public Records
Map
Nearby Homes
- 235 8th St
- 1212 Croft Ave
- 1206 Croft Ave
- 256 7th St
- 200 10th St Unit 65
- 327 Orchard Ave
- 15610 Goldbar Dr
- 40018 May Creek Rd
- 40925 Mountain View Place W
- 314 1st St
- 40928 Wallace Falls Loop Rd
- 1512 Alder Ln
- 115 Grand Ave W
- 15902 Larson Dr
- 215 19th St
- The Amber Plan at Fall View
- The Lewis Plan at Fall View
- The Bennett Plan at Fall View
- The Ellis – Duplex Unit A Plan at Fall View
- The Brooke Plan at Fall View