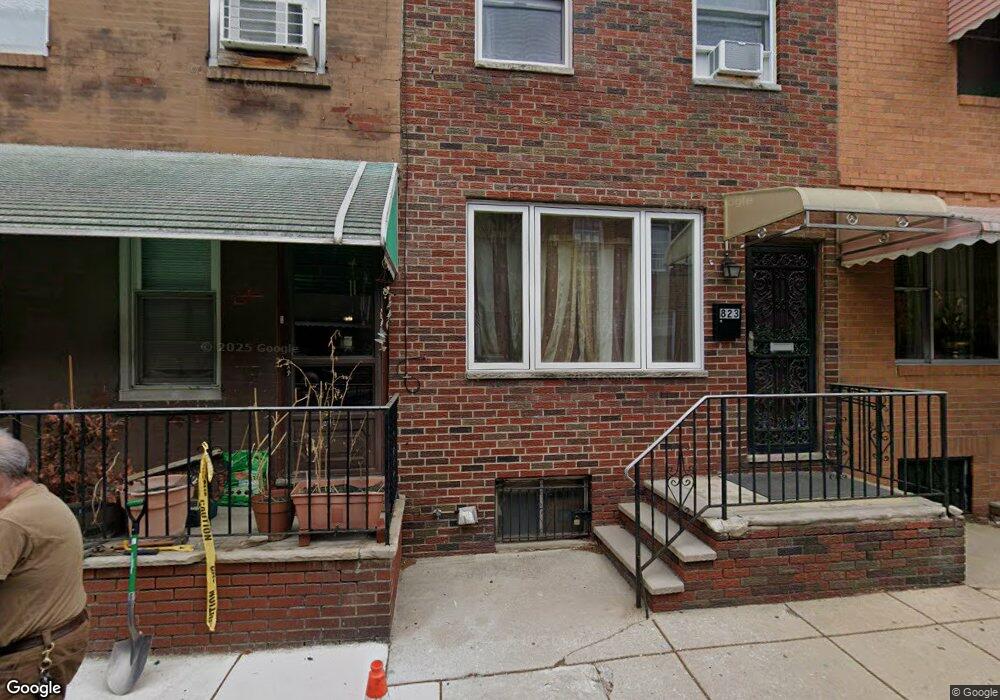
823 Pierce St Philadelphia, PA 19148
East Passyunk NeighborhoodEstimated Value: $277,000 - $328,000
3
Beds
1
Bath
1,109
Sq Ft
$269/Sq Ft
Est. Value
About This Home
This home is located at 823 Pierce St, Philadelphia, PA 19148 and is currently estimated at $298,857, approximately $269 per square foot. 823 Pierce St is a home located in Philadelphia County with nearby schools including Southwark School, South Philadelphia High School, and Our Lady of Hope.
Ownership History
Date
Name
Owned For
Owner Type
Purchase Details
Closed on
Apr 10, 2008
Sold by
Chang Jimmy
Bought by
Chen Xiu Mei
Current Estimated Value
Home Financials for this Owner
Home Financials are based on the most recent Mortgage that was taken out on this home.
Original Mortgage
$80,000
Interest Rate
6.1%
Mortgage Type
Purchase Money Mortgage
Purchase Details
Closed on
Jun 24, 2005
Sold by
Chang Oi Leung and Chang Sau Chun
Bought by
Chang Jimmy
Create a Home Valuation Report for This Property
The Home Valuation Report is an in-depth analysis detailing your home's value as well as a comparison with similar homes in the area
Home Values in the Area
Average Home Value in this Area
Purchase History
| Date | Buyer | Sale Price | Title Company |
|---|---|---|---|
| Chen Xiu Mei | $100,000 | None Available | |
| Chang Jimmy | -- | -- |
Source: Public Records
Mortgage History
| Date | Status | Borrower | Loan Amount |
|---|---|---|---|
| Closed | Chen Xiu Mei | $80,000 |
Source: Public Records
Tax History Compared to Growth
Tax History
| Year | Tax Paid | Tax Assessment Tax Assessment Total Assessment is a certain percentage of the fair market value that is determined by local assessors to be the total taxable value of land and additions on the property. | Land | Improvement |
|---|---|---|---|---|
| 2025 | $3,476 | $276,800 | $55,360 | $221,440 |
| 2024 | $3,476 | $276,800 | $55,360 | $221,440 |
| 2023 | $3,476 | $248,300 | $49,660 | $198,640 |
| 2022 | $2,356 | $203,300 | $49,660 | $153,640 |
| 2021 | $2,870 | $0 | $0 | $0 |
| 2020 | $2,870 | $0 | $0 | $0 |
| 2019 | $2,648 | $0 | $0 | $0 |
| 2018 | $2,314 | $0 | $0 | $0 |
| 2017 | $2,734 | $0 | $0 | $0 |
| 2016 | $2,314 | $0 | $0 | $0 |
| 2015 | $2,139 | $0 | $0 | $0 |
| 2014 | -- | $189,600 | $14,538 | $175,062 |
| 2012 | -- | $9,088 | $1,258 | $7,830 |
Source: Public Records
Map
Nearby Homes