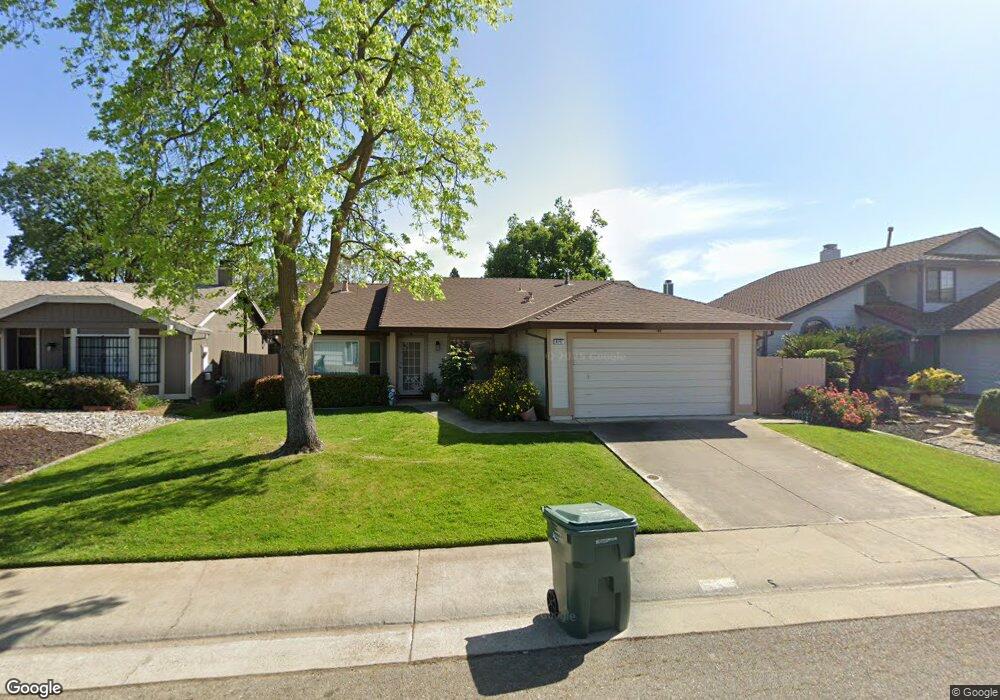
8242 Winkler Way Sacramento, CA 95828
Estimated Value: $336,000 - $468,000
3
Beds
2
Baths
1,510
Sq Ft
$285/Sq Ft
Est. Value
About This Home
This home is located at 8242 Winkler Way, Sacramento, CA 95828 and is currently estimated at $430,068, approximately $284 per square foot. 8242 Winkler Way is a home located in Sacramento County with nearby schools including Anna Kirchgater Elementary School, James Rutter Middle School, and Florin High School.
Ownership History
Date
Name
Owned For
Owner Type
Purchase Details
Closed on
Feb 16, 2005
Sold by
Crawford Roslyn E and Crawford Living Trust
Bought by
Crawford Roslyn E
Current Estimated Value
Home Financials for this Owner
Home Financials are based on the most recent Mortgage that was taken out on this home.
Original Mortgage
$174,000
Interest Rate
5.73%
Mortgage Type
New Conventional
Purchase Details
Closed on
Oct 18, 2002
Sold by
Crawford Roslyn E
Bought by
Crawford Roslyn E and Crawford Living Trust
Home Financials for this Owner
Home Financials are based on the most recent Mortgage that was taken out on this home.
Original Mortgage
$135,000
Interest Rate
5.88%
Purchase Details
Closed on
Jan 27, 2002
Sold by
Crawford Roslyn E
Bought by
Crawford Roslyn E and Crawford Living Trust
Create a Home Valuation Report for This Property
The Home Valuation Report is an in-depth analysis detailing your home's value as well as a comparison with similar homes in the area
Home Values in the Area
Average Home Value in this Area
Purchase History
| Date | Buyer | Sale Price | Title Company |
|---|---|---|---|
| Crawford Roslyn E | -- | Placer Title Company | |
| Crawford Roslyn E | -- | Financial Title Company | |
| Crawford Roslyn E | -- | Financial Title Company | |
| Crawford Roslyn E | -- | -- |
Source: Public Records
Mortgage History
| Date | Status | Borrower | Loan Amount |
|---|---|---|---|
| Closed | Crawford Roslyn E | $174,000 | |
| Closed | Crawford Roslyn E | $135,000 |
Source: Public Records
Tax History Compared to Growth
Tax History
| Year | Tax Paid | Tax Assessment Tax Assessment Total Assessment is a certain percentage of the fair market value that is determined by local assessors to be the total taxable value of land and additions on the property. | Land | Improvement |
|---|---|---|---|---|
| 2025 | $2,407 | $218,782 | $64,373 | $154,409 |
| 2024 | $2,407 | $214,493 | $63,111 | $151,382 |
| 2023 | $2,348 | $210,288 | $61,874 | $148,414 |
| 2022 | $2,309 | $206,165 | $60,661 | $145,504 |
| 2021 | $2,283 | $202,123 | $59,472 | $142,651 |
| 2020 | $2,253 | $200,052 | $58,863 | $141,189 |
| 2019 | $2,213 | $196,130 | $57,709 | $138,421 |
| 2018 | $2,155 | $192,285 | $56,578 | $135,707 |
| 2017 | $2,118 | $188,516 | $55,469 | $133,047 |
| 2016 | $2,015 | $184,821 | $54,382 | $130,439 |
| 2015 | $1,978 | $182,046 | $53,566 | $128,480 |
| 2014 | $1,946 | $178,481 | $52,517 | $125,964 |
Source: Public Records
Map
Nearby Homes
- 7905 Springarden Way
- 8266 Summer Sunset Dr
- 8346 Floxtree Ct
- 8282 Union Creek Way
- 8336 Summer Sunset Dr
- 8077 Goran Ct
- 8186 Gustine Way
- 8205 Weyburn Ct
- 4.13 ACR Lenhart Rd
- 8336 Cutler Way
- 8016 Stevenson Ave
- 7901 Stevenson Ave
- 8012 Northern Oak Cir
- 8437 Yermo Way
- 8510 Cavendish Way
- 7711 Lenhart Rd
- 8095 E Stockton Blvd
- 8317 Honeycomb Way
- 7855 Cottonwood Ln Unit 54
- 7855 Cottonwood Ln Unit 35
- 8246 Winkler Way
- 8238 Winkler Way
- 7980 Clavell Ct
- 7985 Clavell Ct
- 8234 Winkler Way
- 8266 Winkler Way
- 8241 Winkler Way
- 8268 Winkler Way
- 8245 Winkler Way
- 8237 Winkler Way
- 8272 Winkler Way
- 8230 Winkler Way
- 8249 Winkler Way
- 7984 Clavell Ct
- 8233 Winkler Way
- 7989 Clavell Ct
- 8276 Winkler Way
- 8253 Winkler Way
- 8226 Winkler Way
- 8229 Winkler Way