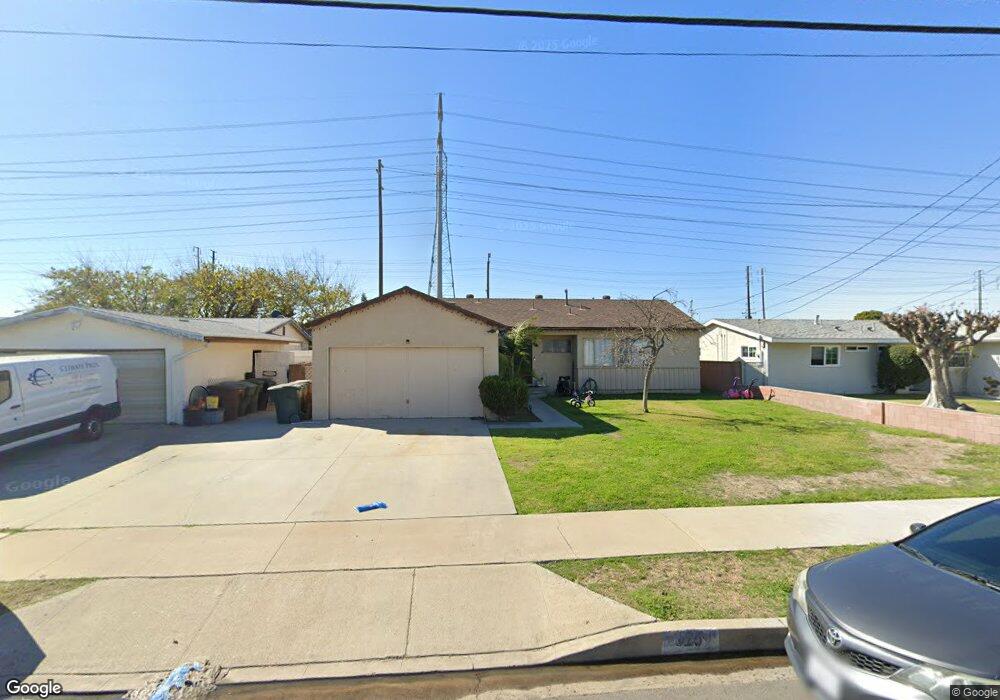
825 N La Reina St Anaheim, CA 92801
Northwest Anaheim NeighborhoodEstimated Value: $809,000 - $923,000
4
Beds
2
Baths
1,184
Sq Ft
$741/Sq Ft
Est. Value
About This Home
This home is located at 825 N La Reina St, Anaheim, CA 92801 and is currently estimated at $876,955, approximately $740 per square foot. 825 N La Reina St is a home located in Orange County with nearby schools including Dr. Peter Marshall Elementary School, Brookhurst Junior High School, and Savanna High School.
Ownership History
Date
Name
Owned For
Owner Type
Purchase Details
Closed on
Aug 22, 2017
Sold by
Luevanos Silvia Torres and Castillo Pedro L
Bought by
Luevanos Silvia Torres and Castillo Ivy Elizabeth
Current Estimated Value
Home Financials for this Owner
Home Financials are based on the most recent Mortgage that was taken out on this home.
Original Mortgage
$301,000
Outstanding Balance
$251,161
Interest Rate
3.96%
Mortgage Type
New Conventional
Estimated Equity
$625,794
Purchase Details
Closed on
Jun 9, 2010
Sold by
Fox Franklin Dale and Fox Susan Jane
Bought by
Luevanos Silvia Torres and Castillo Pedro L
Home Financials for this Owner
Home Financials are based on the most recent Mortgage that was taken out on this home.
Original Mortgage
$330,548
Interest Rate
5.25%
Mortgage Type
FHA
Purchase Details
Closed on
Apr 19, 2010
Sold by
Fox Franklin Dale
Bought by
Fox Franklin Dale and Fox Susan Jane
Home Financials for this Owner
Home Financials are based on the most recent Mortgage that was taken out on this home.
Original Mortgage
$330,548
Interest Rate
5.25%
Mortgage Type
FHA
Create a Home Valuation Report for This Property
The Home Valuation Report is an in-depth analysis detailing your home's value as well as a comparison with similar homes in the area
Home Values in the Area
Average Home Value in this Area
Purchase History
| Date | Buyer | Sale Price | Title Company |
|---|---|---|---|
| Luevanos Silvia Torres | -- | Wfg National Title Co | |
| Luevanos Silvia Torres | $335,000 | Chicago Title Company | |
| Fox Franklin Dale | -- | None Available |
Source: Public Records
Mortgage History
| Date | Status | Borrower | Loan Amount |
|---|---|---|---|
| Open | Luevanos Silvia Torres | $301,000 | |
| Previous Owner | Luevanos Silvia Torres | $330,548 |
Source: Public Records
Tax History Compared to Growth
Tax History
| Year | Tax Paid | Tax Assessment Tax Assessment Total Assessment is a certain percentage of the fair market value that is determined by local assessors to be the total taxable value of land and additions on the property. | Land | Improvement |
|---|---|---|---|---|
| 2025 | $5,936 | $530,341 | $471,138 | $59,203 |
| 2024 | $5,936 | $519,943 | $461,900 | $58,043 |
| 2023 | $5,782 | $509,749 | $452,844 | $56,905 |
| 2022 | $5,726 | $499,754 | $443,964 | $55,790 |
| 2021 | $5,657 | $489,955 | $435,258 | $54,697 |
| 2020 | $5,626 | $484,932 | $430,795 | $54,137 |
| 2019 | $5,484 | $475,424 | $422,348 | $53,076 |
| 2018 | $5,416 | $466,102 | $414,066 | $52,036 |
| 2017 | $4,279 | $369,807 | $315,285 | $54,522 |
| 2016 | $4,257 | $362,556 | $309,103 | $53,453 |
| 2015 | $4,220 | $357,111 | $304,460 | $52,651 |
| 2014 | $4,008 | $350,116 | $298,496 | $51,620 |
Source: Public Records
Map
Nearby Homes
- 605 N La Reina St
- 8319 Hickory Dr
- 8054 Teakwood Cir
- 2625 W Cameron Ct Unit 121
- 2544 W Greenacre Ave
- 2709 W Madison Cir
- 400 N Syracuse St
- 1006 N Hampton Place
- 8434 Periwinkle Dr
- 1028 N Mayflower St
- 199 N Magnolia Ave Unit B
- 525 N Gilbert St Unit 106
- 525 N Gilbert St Unit 151
- 728 N Geneva St
- 2955 W Lincoln Ave Unit 7
- 21 Centerstone Cir
- 2871 W Tyler Ave
- 8452 Stanton Ave
- 1012 N Doria St
- 2770 W Lincoln Ave Unit 29A
- 829 N La Reina St
- 821 N La Reina St
- 833 N La Reina St
- 2606 W Shadow Ln
- 2677 W Greenleaf Ave
- 837 N La Reina St
- 813 N La Reina St
- 2610 W Shadow Ln
- 2673 W Greenleaf Ave
- 901 N La Reina St
- 812 N La Reina St
- 809 N La Reina St
- 2605 W Shadow Ln
- 2614 W Shadow Ln
- 2669 W Greenleaf Ave
- 808 N La Reina St
- 905 N La Reina St
- 805 N La Reina St
- 813 N Aurora St
- 2618 W Shadow Ln