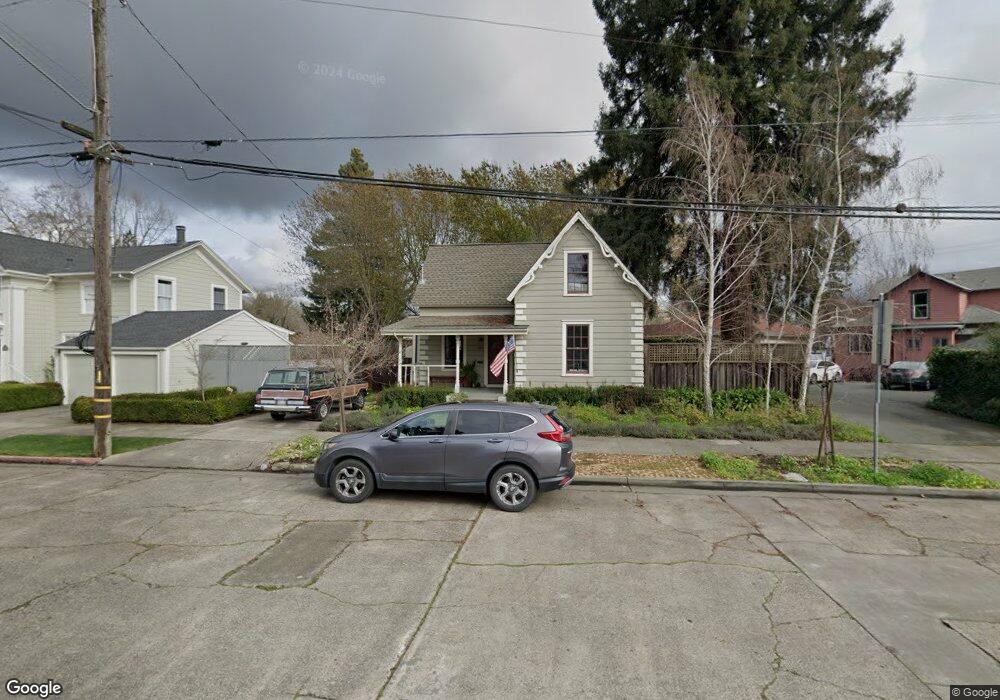
826 St Helena Ave Santa Rosa, CA 95404
Junior College NeighborhoodEstimated Value: $893,942 - $1,100,000
4
Beds
2
Baths
3,081
Sq Ft
$313/Sq Ft
Est. Value
About This Home
This home is located at 826 St Helena Ave, Santa Rosa, CA 95404 and is currently estimated at $965,736, approximately $313 per square foot. 826 St Helena Ave is a home with nearby schools including Proctor Terrace Elementary School, Santa Rosa Middle School, and Santa Rosa High School.
Ownership History
Date
Name
Owned For
Owner Type
Purchase Details
Closed on
Nov 10, 2015
Sold by
Bertolino Rudolph D and Autrey Donna Jean
Bought by
The Rudolph D Bertolino & Donna J Autrey
Current Estimated Value
Purchase Details
Closed on
Jul 9, 2014
Sold by
Bertolino Rudy
Bought by
Bertolino Rudy and Autrey Donna Jean
Purchase Details
Closed on
Jun 25, 2004
Sold by
Autrey Donna Jean
Bought by
Bertolino Rudy
Home Financials for this Owner
Home Financials are based on the most recent Mortgage that was taken out on this home.
Original Mortgage
$439,200
Outstanding Balance
$218,575
Interest Rate
6.27%
Mortgage Type
Commercial
Estimated Equity
$747,161
Purchase Details
Closed on
Jun 21, 2004
Sold by
Egan Leo G and Egan Mary Ann
Bought by
Bertolino Rudy
Home Financials for this Owner
Home Financials are based on the most recent Mortgage that was taken out on this home.
Original Mortgage
$439,200
Outstanding Balance
$218,575
Interest Rate
6.27%
Mortgage Type
Commercial
Estimated Equity
$747,161
Create a Home Valuation Report for This Property
The Home Valuation Report is an in-depth analysis detailing your home's value as well as a comparison with similar homes in the area
Home Values in the Area
Average Home Value in this Area
Purchase History
| Date | Buyer | Sale Price | Title Company |
|---|---|---|---|
| The Rudolph D Bertolino & Donna J Autrey | -- | None Available | |
| Bertolino Rudy | -- | First American Title Co | |
| Bertolino Rudy | -- | Fidelity National Title Co | |
| Bertolino Rudy | $549,000 | Fidelity National Title Co |
Source: Public Records
Mortgage History
| Date | Status | Borrower | Loan Amount |
|---|---|---|---|
| Open | Bertolino Rudy | $439,200 |
Source: Public Records
Tax History Compared to Growth
Tax History
| Year | Tax Paid | Tax Assessment Tax Assessment Total Assessment is a certain percentage of the fair market value that is determined by local assessors to be the total taxable value of land and additions on the property. | Land | Improvement |
|---|---|---|---|---|
| 2025 | $8,612 | $765,235 | $139,378 | $625,857 |
| 2024 | $8,612 | $750,232 | $136,646 | $613,586 |
| 2023 | $8,612 | $735,522 | $133,967 | $601,555 |
| 2022 | $7,954 | $721,101 | $131,341 | $589,760 |
| 2021 | $7,858 | $706,963 | $128,766 | $578,197 |
| 2020 | $7,841 | $699,715 | $127,446 | $572,269 |
| 2019 | $7,800 | $685,997 | $124,948 | $561,049 |
| 2018 | $7,759 | $672,548 | $122,499 | $550,049 |
| 2017 | $7,644 | $659,362 | $120,098 | $539,264 |
| 2016 | $7,596 | $646,435 | $117,744 | $528,691 |
| 2015 | $7,367 | $636,726 | $115,976 | $520,750 |
| 2014 | $6,917 | $624,255 | $113,705 | $510,550 |
Source: Public Records
Map
Nearby Homes
- 109 Alderbrook Dr
- 1805 Austin Way
- 265 Doyle Park Dr
- 266 Doyle Park Dr
- 1240 North St
- 642 Wright St
- 1640 Julianne Place
- 1320 North St Unit 33
- 1000 Sonoma Ave
- 840 5th St
- 804 Beaver St
- 204 Yates Dr
- 722 Beaver St
- 2219 Grace Dr
- 763 Beaver St
- 743 Beaver St
- 726 Orchard St
- 722 Orchard St
- 810 7th St Unit 23
- 705 College Ave
- 814 Saint Helena Ave
- 1533 4th St
- 1501 4th St
- 1608 Austin Way
- 829 Saint Helena Ave
- 825 Saint Helena Ave
- 1601 4th St
- 819 St Helena Ave
- 819 Saint Helena Ave
- 1612 Austin Way
- 813 Saint Helena Ave
- 901 Saint Helena Ave
- 1506 4th St
- 1520 14th St
- 1618 Austin Way
- 911 Saint Helena Ave
- 1605 4th St
- 1601 Austin Way
- 1516 4th St
- 915 Saint Helena Ave