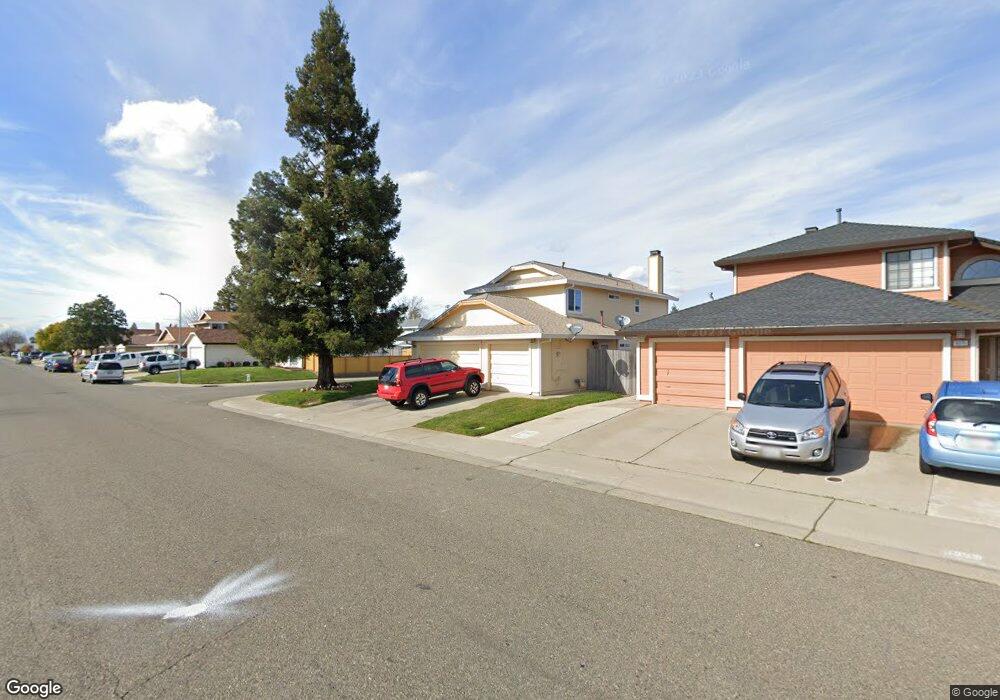
8267 Turnbury Dr Sacramento, CA 95828
Estimated Value: $496,000 - $526,000
4
Beds
3
Baths
1,940
Sq Ft
$264/Sq Ft
Est. Value
About This Home
This home is located at 8267 Turnbury Dr, Sacramento, CA 95828 and is currently estimated at $511,512, approximately $263 per square foot. 8267 Turnbury Dr is a home located in Sacramento County with nearby schools including Anna Kirchgater Elementary School, James Rutter Middle School, and Florin High School.
Ownership History
Date
Name
Owned For
Owner Type
Purchase Details
Closed on
Sep 8, 2005
Sold by
Moore Jacqueline D
Bought by
Moore Jacqueline D
Current Estimated Value
Home Financials for this Owner
Home Financials are based on the most recent Mortgage that was taken out on this home.
Original Mortgage
$344,000
Outstanding Balance
$182,999
Interest Rate
5.76%
Mortgage Type
New Conventional
Estimated Equity
$328,513
Purchase Details
Closed on
Nov 3, 1999
Sold by
Va
Bought by
Moore Jacqueline D
Home Financials for this Owner
Home Financials are based on the most recent Mortgage that was taken out on this home.
Original Mortgage
$131,040
Interest Rate
7.75%
Mortgage Type
Seller Take Back
Purchase Details
Closed on
Jun 11, 1998
Sold by
Homeside Lending Inc
Bought by
Va
Purchase Details
Closed on
Jun 9, 1998
Sold by
Marvich Michael Domanic and Marvich Patricia
Bought by
Homeside Lending Inc and Bancboston Mtg Corp
Create a Home Valuation Report for This Property
The Home Valuation Report is an in-depth analysis detailing your home's value as well as a comparison with similar homes in the area
Home Values in the Area
Average Home Value in this Area
Purchase History
| Date | Buyer | Sale Price | Title Company |
|---|---|---|---|
| Moore Jacqueline D | -- | Ticor Title Company Of Ca | |
| Moore Jacqueline D | $146,000 | -- | |
| Va | -- | First Southwestern Title Co | |
| Homeside Lending Inc | $113,129 | First Southwestern Title |
Source: Public Records
Mortgage History
| Date | Status | Borrower | Loan Amount |
|---|---|---|---|
| Open | Moore Jacqueline D | $344,000 | |
| Closed | Moore Jacqueline D | $131,040 |
Source: Public Records
Tax History Compared to Growth
Tax History
| Year | Tax Paid | Tax Assessment Tax Assessment Total Assessment is a certain percentage of the fair market value that is determined by local assessors to be the total taxable value of land and additions on the property. | Land | Improvement |
|---|---|---|---|---|
| 2025 | $7,804 | $223,758 | $61,465 | $162,293 |
| 2024 | $7,804 | $219,371 | $60,260 | $159,111 |
| 2023 | $7,743 | $215,071 | $59,079 | $155,992 |
| 2022 | $7,682 | $210,855 | $57,921 | $152,934 |
| 2021 | $7,656 | $206,722 | $56,786 | $149,936 |
| 2020 | $7,625 | $204,603 | $56,204 | $148,399 |
| 2019 | $7,584 | $200,592 | $55,102 | $145,490 |
| 2018 | $7,525 | $196,660 | $54,022 | $142,638 |
| 2017 | $5,246 | $192,805 | $52,963 | $139,842 |
| 2016 | $2,058 | $189,025 | $51,925 | $137,100 |
| 2015 | $2,020 | $186,187 | $51,146 | $135,041 |
| 2014 | $1,987 | $182,541 | $50,145 | $132,396 |
Source: Public Records
Map
Nearby Homes
- 8266 Summer Sunset Dr
- 8346 Floxtree Ct
- 7905 Springarden Way
- 8282 Union Creek Way
- 8336 Summer Sunset Dr
- 8077 Goran Ct
- 8186 Gustine Way
- 8205 Weyburn Ct
- 8336 Cutler Way
- 4.13 ACR Lenhart Rd
- 8016 Stevenson Ave
- 8012 Northern Oak Cir
- 7901 Stevenson Ave
- 8437 Yermo Way
- 8510 Cavendish Way
- 7711 Lenhart Rd
- 7855 Cottonwood Ln Unit 54
- 7855 Cottonwood Ln Unit 35
- 8317 Honeycomb Way
- 8095 E Stockton Blvd
- 8271 Turnbury Dr
- 7989 Clavell Ct
- 8261 Turnbury Dr
- 8284 Winkler Way
- 8280 Winkler Way
- 8268 Turnbury Dr
- 8266 Turnbury Dr
- 7985 Clavell Ct
- 7988 Clavell Ct
- 8257 Turnbury Dr
- 8272 Turnbury Dr
- 8276 Winkler Way
- 8262 Turnbury Dr
- 7980 Clavell Ct
- 8276 Turnbury Dr
- 8258 Turnbury Dr
- 8272 Winkler Way
- 7984 Clavell Ct
- 8253 Turnbury Dr
- 8280 Turnbury Dr