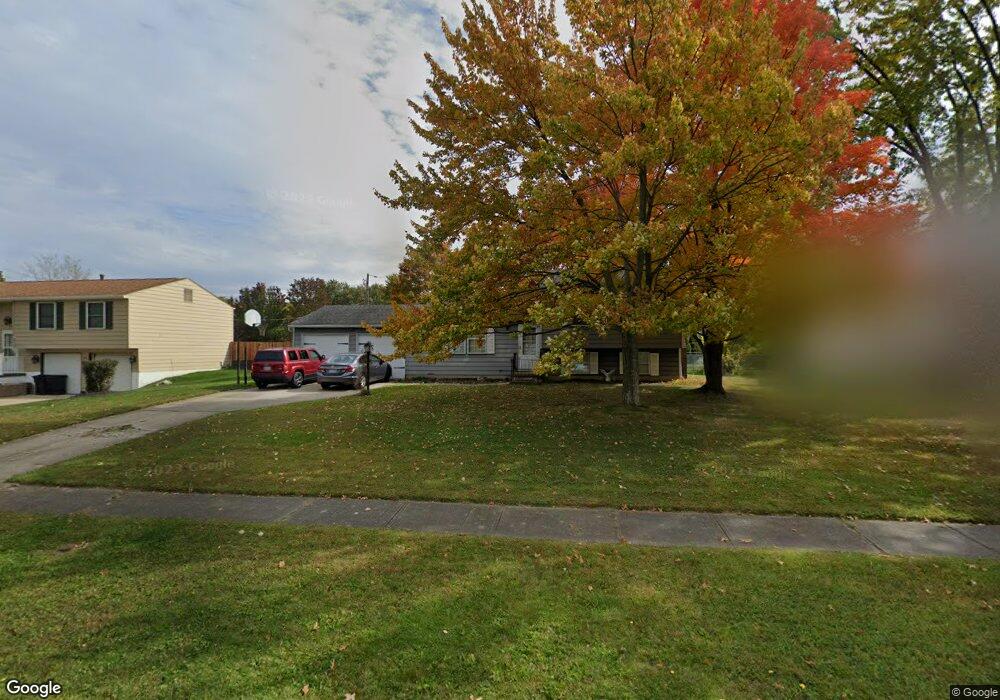
8281 Celianna Dr Strongsville, OH 44149
Estimated Value: $276,045 - $342,000
3
Beds
2
Baths
1,520
Sq Ft
$201/Sq Ft
Est. Value
About This Home
This home is located at 8281 Celianna Dr, Strongsville, OH 44149 and is currently estimated at $305,511, approximately $200 per square foot. 8281 Celianna Dr is a home located in Cuyahoga County with nearby schools including Strongsville High School, St Mary School, and Sts Joseph & John Interparochial School.
Ownership History
Date
Name
Owned For
Owner Type
Purchase Details
Closed on
Aug 7, 1995
Sold by
Polak James P
Bought by
Hovanec Ronald S and Hovanec Judy G
Current Estimated Value
Home Financials for this Owner
Home Financials are based on the most recent Mortgage that was taken out on this home.
Original Mortgage
$123,400
Interest Rate
7.56%
Mortgage Type
VA
Purchase Details
Closed on
Aug 18, 1992
Sold by
Vadini Joseph S
Bought by
Polak James P
Purchase Details
Closed on
Jan 28, 1991
Sold by
Tamburro James M
Bought by
Vadini Joseph S
Purchase Details
Closed on
Dec 3, 1987
Sold by
Olexa John F and Olexa Charlotte N
Bought by
Tamburro James M
Purchase Details
Closed on
Feb 1, 1984
Sold by
Locher Robert G and Locher Janet L
Bought by
Olexa John F and Olexa Charlotte N
Purchase Details
Closed on
Aug 7, 1975
Sold by
Locher Robert G and Locher Janet L
Bought by
Locher Robert G and Locher Janet L
Purchase Details
Closed on
Jan 1, 1975
Bought by
Locher Robert G and Locher Janet L
Create a Home Valuation Report for This Property
The Home Valuation Report is an in-depth analysis detailing your home's value as well as a comparison with similar homes in the area
Home Values in the Area
Average Home Value in this Area
Purchase History
| Date | Buyer | Sale Price | Title Company |
|---|---|---|---|
| Hovanec Ronald S | $121,000 | -- | |
| Polak James P | $109,700 | -- | |
| Vadini Joseph S | $92,000 | -- | |
| Tamburro James M | $77,000 | -- | |
| Olexa John F | $67,900 | -- | |
| Locher Robert G | -- | -- | |
| Locher Robert G | -- | -- |
Source: Public Records
Mortgage History
| Date | Status | Borrower | Loan Amount |
|---|---|---|---|
| Closed | Hovanec Ronald S | $123,400 |
Source: Public Records
Tax History Compared to Growth
Tax History
| Year | Tax Paid | Tax Assessment Tax Assessment Total Assessment is a certain percentage of the fair market value that is determined by local assessors to be the total taxable value of land and additions on the property. | Land | Improvement |
|---|---|---|---|---|
| 2024 | $3,758 | $80,045 | $19,145 | $60,900 |
| 2023 | $3,940 | $62,930 | $16,170 | $46,760 |
| 2022 | $3,912 | $62,930 | $16,170 | $46,760 |
| 2021 | $3,881 | $62,930 | $16,170 | $46,760 |
| 2020 | $3,597 | $51,590 | $13,270 | $38,330 |
| 2019 | $3,491 | $147,400 | $37,900 | $109,500 |
| 2018 | $3,141 | $51,590 | $13,270 | $38,330 |
| 2017 | $3,172 | $47,810 | $10,990 | $36,820 |
| 2016 | $3,146 | $47,810 | $10,990 | $36,820 |
| 2015 | $3,098 | $47,810 | $10,990 | $36,820 |
| 2014 | $3,098 | $46,420 | $10,680 | $35,740 |
Source: Public Records
Map
Nearby Homes
- 8036 Fair Rd
- 8902 Lincolnshire Blvd
- 458 Sprague Rd
- 243 Jananna Dr
- 740 Fair St
- 8627 Courtland Dr
- 8746 Barton Dr
- 84 Sprague Rd
- 148 Meadow Cir
- 23004 Chandlers Ln Unit 109
- 104 Whitehall Dr
- 647 Tampico Ct Unit 7
- 23003 Chandlers Ln Unit 230
- 648 Tampico Ct Unit 37
- 9598 Pebble Brook Ln
- 9384 N Marks Rd
- 9797 Sugarbush Cir
- 23002 Chandlers Ln
- 23002 Chandlers Ln Unit 342
- 23002 Chandlers Ln Unit 221
- 8251 Celianna Dr
- 8289 Celianna Dr
- 8288 Lincolnshire Blvd
- 8328 Lincolnshire Blvd
- 8248 Lincolnshire Blvd
- 8301 Celianna Dr
- 22241 Lorraine Dr
- 8368 Lincolnshire Blvd
- 22245 Lorraine Dr
- 8313 Celianna Dr
- 8300 Celianna Dr
- 22236 Lorraine Dr
- 8376 Lincolnshire Blvd
- 22240 Lorraine Dr
- 22230 Lorraine Dr
- 22251 Lorraine Dr
- 22226 Lorraine Dr
- 22244 Lorraine Dr
- 8308 Celianna Dr
- 8418 Lincolnshire Blvd