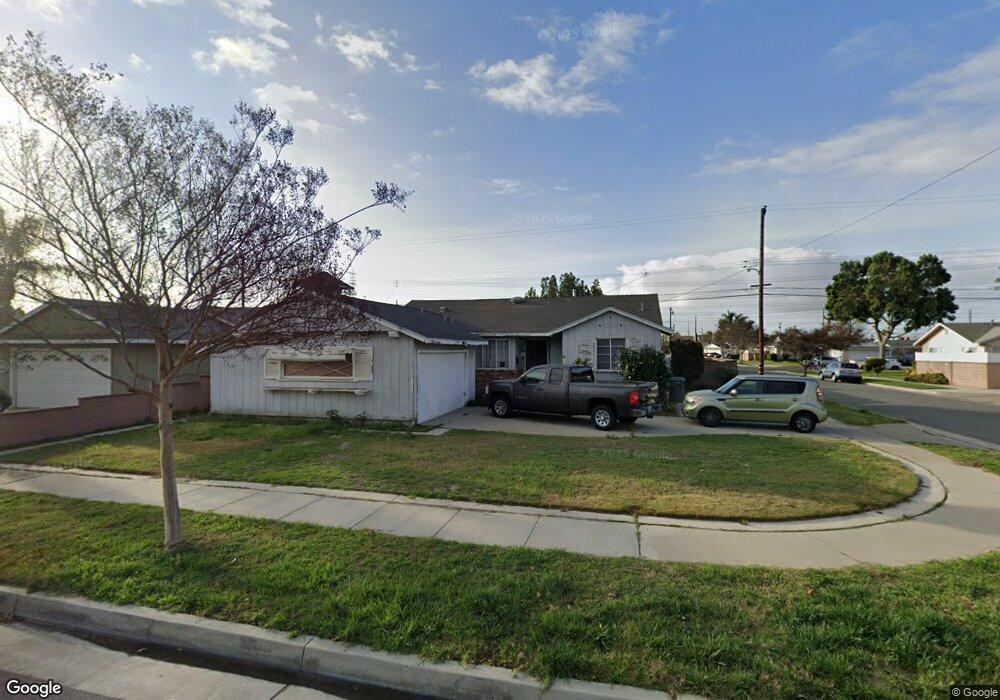
8296 Philodendron Way Buena Park, CA 90620
Estimated Value: $675,000 - $899,000
3
Beds
2
Baths
1,258
Sq Ft
$652/Sq Ft
Est. Value
About This Home
This home is located at 8296 Philodendron Way, Buena Park, CA 90620 and is currently estimated at $820,607, approximately $652 per square foot. 8296 Philodendron Way is a home located in Orange County with nearby schools including Glen H. Dysinger Sr. Elementary School, Brookhurst Junior High School, and Savanna High School.
Ownership History
Date
Name
Owned For
Owner Type
Purchase Details
Closed on
Apr 21, 2017
Sold by
Petrocelly Mike V and Nicholson Gerald L
Bought by
Petrocelly Mike V
Current Estimated Value
Home Financials for this Owner
Home Financials are based on the most recent Mortgage that was taken out on this home.
Original Mortgage
$246,000
Outstanding Balance
$204,821
Interest Rate
4.23%
Mortgage Type
New Conventional
Estimated Equity
$615,786
Purchase Details
Closed on
Oct 29, 2001
Sold by
Petrocelly Lisa
Bought by
Petrocelly Mike
Home Financials for this Owner
Home Financials are based on the most recent Mortgage that was taken out on this home.
Original Mortgage
$234,685
Interest Rate
6.84%
Mortgage Type
FHA
Purchase Details
Closed on
Sep 21, 2001
Sold by
Gentry Richard
Bought by
Petrocelly Mike and Nicholson Gerald L
Home Financials for this Owner
Home Financials are based on the most recent Mortgage that was taken out on this home.
Original Mortgage
$234,685
Interest Rate
6.84%
Mortgage Type
FHA
Create a Home Valuation Report for This Property
The Home Valuation Report is an in-depth analysis detailing your home's value as well as a comparison with similar homes in the area
Home Values in the Area
Average Home Value in this Area
Purchase History
| Date | Buyer | Sale Price | Title Company |
|---|---|---|---|
| Petrocelly Mike V | $205,000 | Servicelink | |
| Petrocelly Mike | -- | Southland Title Corporation | |
| Petrocelly Mike | $238,000 | Southland Title Corporation |
Source: Public Records
Mortgage History
| Date | Status | Borrower | Loan Amount |
|---|---|---|---|
| Open | Petrocelly Mike V | $246,000 | |
| Previous Owner | Petrocelly Mike | $234,685 |
Source: Public Records
Tax History Compared to Growth
Tax History
| Year | Tax Paid | Tax Assessment Tax Assessment Total Assessment is a certain percentage of the fair market value that is determined by local assessors to be the total taxable value of land and additions on the property. | Land | Improvement |
|---|---|---|---|---|
| 2025 | $4,130 | $351,587 | $275,472 | $76,115 |
| 2024 | $4,130 | $344,694 | $270,071 | $74,623 |
| 2023 | $4,026 | $337,936 | $264,776 | $73,160 |
| 2022 | $3,972 | $331,310 | $259,584 | $71,726 |
| 2021 | $3,915 | $324,814 | $254,494 | $70,320 |
| 2020 | $3,891 | $321,484 | $251,885 | $69,599 |
| 2019 | $3,795 | $315,181 | $246,946 | $68,235 |
| 2018 | $3,726 | $309,001 | $242,103 | $66,898 |
| 2017 | $3,609 | $302,943 | $237,356 | $65,587 |
| 2016 | $3,540 | $297,003 | $232,702 | $64,301 |
| 2015 | $3,500 | $292,542 | $229,206 | $63,336 |
| 2014 | $3,326 | $286,812 | $224,716 | $62,096 |
Source: Public Records
Map
Nearby Homes
- 21 Centerstone Cir
- 8194 Calendula Dr
- 8434 Periwinkle Dr
- 8026 Carnation Dr
- 2697 W Parkside Ln
- 7085 Oregon St
- 8054 Teakwood Cir
- 7122 Stanton Ave
- 7911 Orangethorpe Ave
- 8319 Hickory Dr
- 7575 El Escorial Way
- 4231 W Hill Ave
- 7570 El Chaco Dr
- 4260 W Flower Ave
- 8927 Orangethorpe Ave
- 7600 Western Ave
- 6958 Crimson Dr
- 6921 Cottonwood Ln
- 8452 Stanton Ave
- 7791 Melrose St
- 8308 Philodendron Way
- 8297 Carnation Dr
- 8309 Carnation Dr
- 8320 Philodendron Way
- 8279 Philodendron Way
- 8283 Philodendron Way
- 8297 Philodendron Way
- 8273 Carnation Dr
- 8321 Carnation Dr
- 8309 Philodendron Way
- 8291 Philodendron Way
- 8332 Philodendron Way
- 8287 Philodendron Way
- 8321 Philodendron Way
- 8261 Carnation Dr
- 8235 Cyclamen Way
- 8241 Cyclamen Way
- 8333 Philodendron Way
- 8344 Philodendron Way