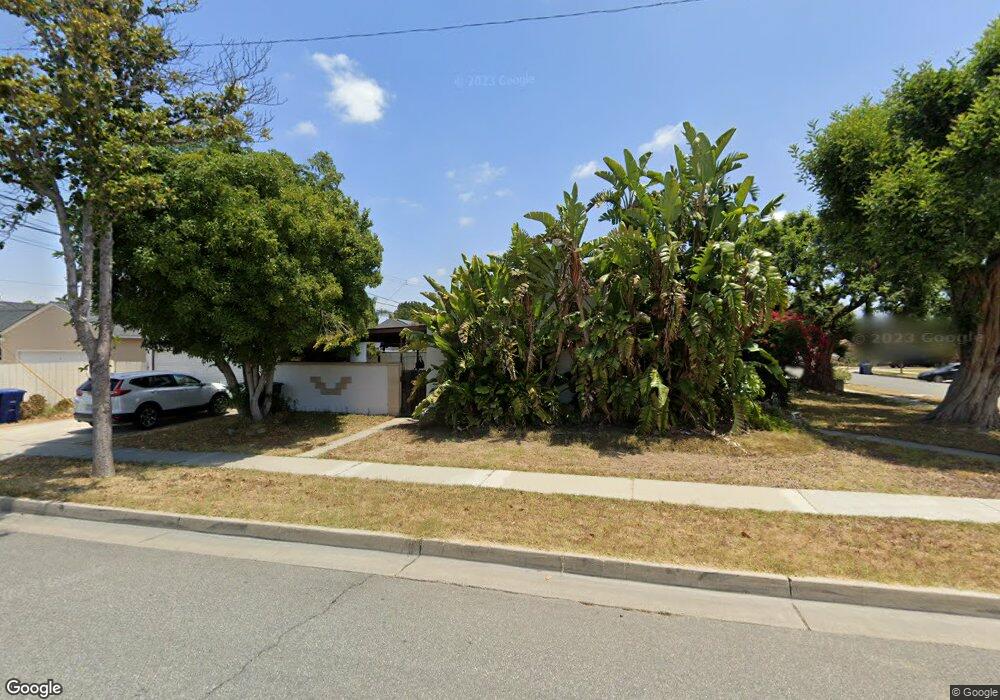
8297 Petunia Way Buena Park, CA 90620
Estimated Value: $807,002 - $847,000
3
Beds
1
Bath
1,219
Sq Ft
$679/Sq Ft
Est. Value
About This Home
This home is located at 8297 Petunia Way, Buena Park, CA 90620 and is currently estimated at $827,251, approximately $678 per square foot. 8297 Petunia Way is a home located in Orange County with nearby schools including Glen H. Dysinger Sr. Elementary School, Brookhurst Junior High School, and Savanna High School.
Ownership History
Date
Name
Owned For
Owner Type
Purchase Details
Closed on
Dec 28, 2009
Sold by
Beckstrom Dennis
Bought by
Butler Beckstrom Nancy
Current Estimated Value
Home Financials for this Owner
Home Financials are based on the most recent Mortgage that was taken out on this home.
Original Mortgage
$180,500
Outstanding Balance
$117,482
Interest Rate
4.78%
Mortgage Type
New Conventional
Estimated Equity
$709,769
Purchase Details
Closed on
May 13, 1997
Sold by
Beckstrom Dennis
Bought by
Butler Beckstrom Nancy
Home Financials for this Owner
Home Financials are based on the most recent Mortgage that was taken out on this home.
Original Mortgage
$156,595
Interest Rate
7.94%
Mortgage Type
FHA
Purchase Details
Closed on
May 9, 1997
Sold by
Thomas Edward C and Thomas Amanda S
Bought by
Beckstrom Nancy Butler
Home Financials for this Owner
Home Financials are based on the most recent Mortgage that was taken out on this home.
Original Mortgage
$156,595
Interest Rate
7.94%
Mortgage Type
FHA
Create a Home Valuation Report for This Property
The Home Valuation Report is an in-depth analysis detailing your home's value as well as a comparison with similar homes in the area
Home Values in the Area
Average Home Value in this Area
Purchase History
| Date | Buyer | Sale Price | Title Company |
|---|---|---|---|
| Butler Beckstrom Nancy | -- | Fidelity National Title | |
| Butler Beckstrom Nancy | -- | Commonwealth Land Title | |
| Beckstrom Nancy Butler | $160,000 | Commonwealth Land Title |
Source: Public Records
Mortgage History
| Date | Status | Borrower | Loan Amount |
|---|---|---|---|
| Open | Butler Beckstrom Nancy | $180,500 | |
| Closed | Beckstrom Nancy Butler | $156,595 |
Source: Public Records
Tax History Compared to Growth
Tax History
| Year | Tax Paid | Tax Assessment Tax Assessment Total Assessment is a certain percentage of the fair market value that is determined by local assessors to be the total taxable value of land and additions on the property. | Land | Improvement |
|---|---|---|---|---|
| 2025 | $3,140 | $260,416 | $184,611 | $75,805 |
| 2024 | $3,140 | $255,310 | $180,991 | $74,319 |
| 2023 | $3,060 | $250,304 | $177,442 | $72,862 |
| 2022 | $3,017 | $245,397 | $173,963 | $71,434 |
| 2021 | $2,973 | $240,586 | $170,552 | $70,034 |
| 2020 | $2,955 | $238,120 | $168,804 | $69,316 |
| 2019 | $2,884 | $233,451 | $165,494 | $67,957 |
| 2018 | $2,831 | $228,874 | $162,249 | $66,625 |
| 2017 | $2,744 | $224,387 | $159,068 | $65,319 |
| 2016 | $2,692 | $219,988 | $155,949 | $64,039 |
| 2015 | $2,660 | $216,684 | $153,606 | $63,078 |
| 2014 | $2,530 | $212,440 | $150,597 | $61,843 |
Source: Public Records
Map
Nearby Homes
- 8194 Calendula Dr
- 7085 Oregon St
- 21 Centerstone Cir
- 8026 Carnation Dr
- 7122 Stanton Ave
- 2697 W Parkside Ln
- 8434 Periwinkle Dr
- 7911 Orangethorpe Ave
- 4231 W Hill Ave
- 4260 W Flower Ave
- 7791 Melrose St
- 8054 Teakwood Cir
- 7575 El Escorial Way
- 7570 El Chaco Dr
- 7600 Western Ave
- 8927 Orangethorpe Ave
- 7451 Western Ave
- 6921 Cottonwood Ln
- 6958 Crimson Dr
- 7579 Melrose St
- 8309 Petunia Way
- 8296 Calendula Dr
- 8308 Calendula Dr
- 8321 Petunia Way
- 8272 Petunia Way
- 8278 Petunia Way
- 8296 Petunia Way
- 8266 Calendula Dr
- 8320 Calendula Dr
- 8308 Petunia Way
- 8290 Petunia Way
- 8333 Petunia Way
- 8284 Petunia Way
- 8320 Petunia Way
- 8332 Calendula Dr
- 8254 Calendula Dr
- 8230 Coral Bell Way
- 8236 Coral Bell Way
- 8332 Petunia Way
- 8345 Petunia Way