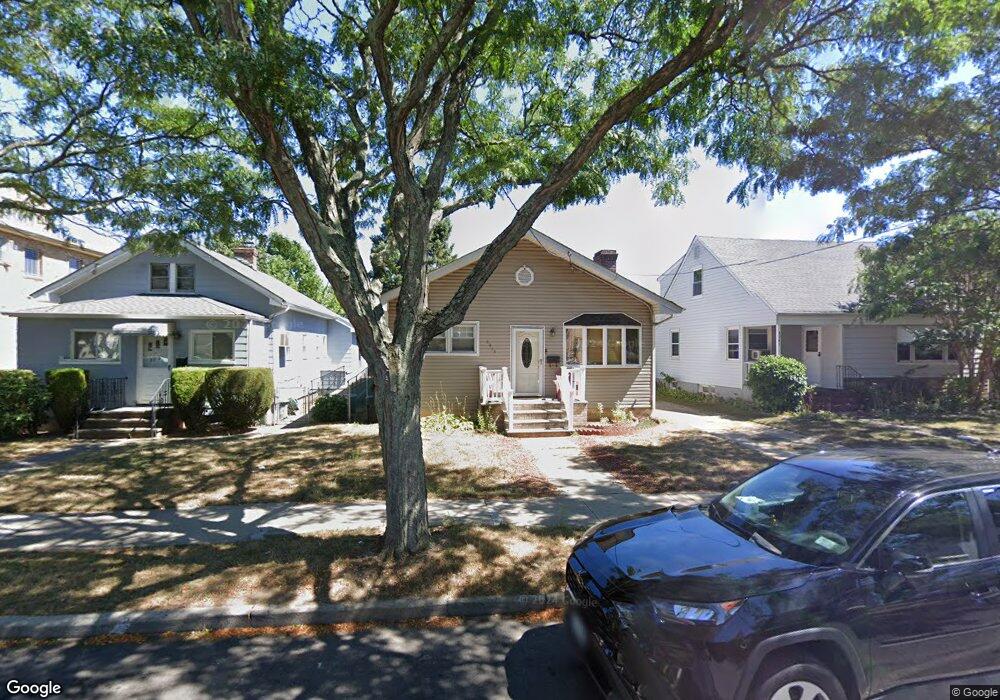
83-35 262nd St Glen Oaks, NY 11004
Estimated Value: $745,220 - $826,000
2
Beds
1
Bath
1,026
Sq Ft
$761/Sq Ft
Est. Value
About This Home
This home is located at 83-35 262nd St, Glen Oaks, NY 11004 and is currently estimated at $780,305, approximately $760 per square foot. 83-35 262nd St is a home located in Queens County with nearby schools including P.S. 191 Mayflower School, Irwin Altman Middle School 172, and Martin Van Buren High School.
Ownership History
Date
Name
Owned For
Owner Type
Purchase Details
Closed on
Aug 27, 2021
Sold by
Demartino Beatrice Ann and Demartino Cherise M
Bought by
Yang Zhaihong and Ye Chunbo
Current Estimated Value
Home Financials for this Owner
Home Financials are based on the most recent Mortgage that was taken out on this home.
Original Mortgage
$410,000
Outstanding Balance
$373,069
Interest Rate
2.8%
Mortgage Type
Purchase Money Mortgage
Estimated Equity
$407,236
Purchase Details
Closed on
Oct 19, 2004
Sold by
Demartino Cherise M
Bought by
Demartino Beatrice A and Demartino Cherise M
Purchase Details
Closed on
Jun 23, 2004
Sold by
Demartino Beatrice Ann and Perrotta Vito R
Bought by
Demartino Cherise M
Home Financials for this Owner
Home Financials are based on the most recent Mortgage that was taken out on this home.
Original Mortgage
$163,000
Interest Rate
6.32%
Mortgage Type
Purchase Money Mortgage
Create a Home Valuation Report for This Property
The Home Valuation Report is an in-depth analysis detailing your home's value as well as a comparison with similar homes in the area
Home Values in the Area
Average Home Value in this Area
Purchase History
| Date | Buyer | Sale Price | Title Company |
|---|---|---|---|
| Yang Zhaihong | $645,000 | -- | |
| Yang Zhaihong | $645,000 | -- | |
| Demartino Beatrice A | -- | -- | |
| Demartino Beatrice A | -- | -- | |
| Demartino Cherise M | $200,000 | -- | |
| Demartino Cherise M | $200,000 | -- |
Source: Public Records
Mortgage History
| Date | Status | Borrower | Loan Amount |
|---|---|---|---|
| Open | Yang Zhaihong | $410,000 | |
| Closed | Yang Zhaihong | $410,000 | |
| Previous Owner | Demartino Cherise M | $163,000 |
Source: Public Records
Tax History Compared to Growth
Tax History
| Year | Tax Paid | Tax Assessment Tax Assessment Total Assessment is a certain percentage of the fair market value that is determined by local assessors to be the total taxable value of land and additions on the property. | Land | Improvement |
|---|---|---|---|---|
| 2025 | $6,649 | $35,076 | $11,902 | $23,174 |
| 2024 | $6,649 | $33,106 | $12,310 | $20,796 |
| 2023 | $6,304 | $31,385 | $11,258 | $20,127 |
| 2022 | $5,922 | $42,900 | $15,840 | $27,060 |
| 2021 | $5,947 | $42,000 | $15,840 | $26,160 |
| 2020 | $5,891 | $40,500 | $15,840 | $24,660 |
| 2019 | $5,478 | $40,200 | $15,840 | $24,360 |
| 2018 | $5,034 | $26,154 | $10,574 | $15,580 |
| 2017 | $4,740 | $24,721 | $11,717 | $13,004 |
| 2016 | $4,632 | $24,721 | $11,717 | $13,004 |
| 2015 | -- | $24,358 | $14,746 | $9,612 |
| 2014 | -- | $22,990 | $11,838 | $11,152 |
Source: Public Records
Map
Nearby Homes
- 8343 261st St
- 8418 263rd St
- 82-44 263rd St
- 83-14 266th St
- 261-16 E Williston Ave
- 258-15 83rd Ave
- 8260 266th St
- 265-08 E Williston Ave
- 84-03 266th St
- 84-05 266th St
- 8436 259th St
- 81-56 264th St
- 83-36 268th St
- 85-23 264th St
- 293 85th Ave
- 85-65 262nd St
- 26612 82nd Ave
- 8133 260th St
- 81-46 266th St
- 268-3 83rd Ave Unit 2nd Fl