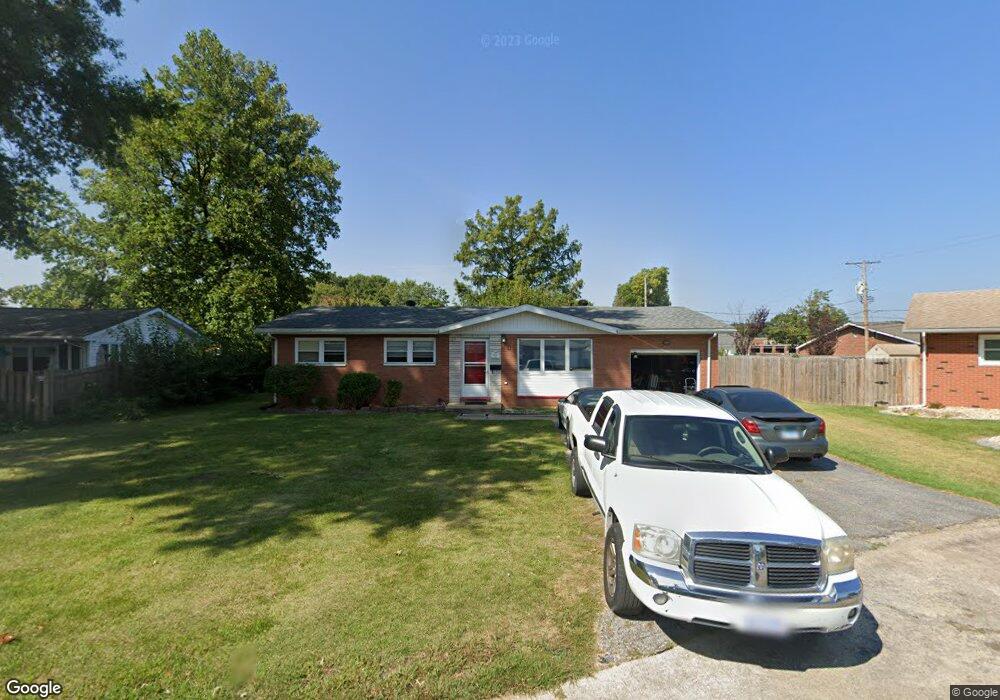
83 Morris Ct Granite City, IL 62040
Estimated Value: $132,000 - $157,000
3
Beds
2
Baths
1,092
Sq Ft
$132/Sq Ft
Est. Value
About This Home
This home is located at 83 Morris Ct, Granite City, IL 62040 and is currently estimated at $144,094, approximately $131 per square foot. 83 Morris Ct is a home located in Madison County with nearby schools including Granite City High School, St. Elizabeth Elementary School, and Metro East Montessori School.
Ownership History
Date
Name
Owned For
Owner Type
Purchase Details
Closed on
Jan 21, 2011
Sold by
Linkeman Dennis
Bought by
Baker Nathan A
Current Estimated Value
Home Financials for this Owner
Home Financials are based on the most recent Mortgage that was taken out on this home.
Original Mortgage
$67,498
Outstanding Balance
$47,038
Interest Rate
5.25%
Mortgage Type
FHA
Estimated Equity
$97,056
Purchase Details
Closed on
Aug 10, 2010
Sold by
Fannie Mae
Bought by
Linkeman Dennis
Purchase Details
Closed on
Nov 17, 2009
Sold by
Glass Christopher A
Bought by
Federal National Mortgage Association
Create a Home Valuation Report for This Property
The Home Valuation Report is an in-depth analysis detailing your home's value as well as a comparison with similar homes in the area
Home Values in the Area
Average Home Value in this Area
Purchase History
| Date | Buyer | Sale Price | Title Company |
|---|---|---|---|
| Baker Nathan A | $82,000 | Metro Title & Escrow Company | |
| Linkeman Dennis | $59,000 | Fatic | |
| Federal National Mortgage Association | -- | None Available |
Source: Public Records
Mortgage History
| Date | Status | Borrower | Loan Amount |
|---|---|---|---|
| Open | Baker Nathan A | $67,498 |
Source: Public Records
Tax History Compared to Growth
Tax History
| Year | Tax Paid | Tax Assessment Tax Assessment Total Assessment is a certain percentage of the fair market value that is determined by local assessors to be the total taxable value of land and additions on the property. | Land | Improvement |
|---|---|---|---|---|
| 2024 | $1,527 | $31,370 | $7,340 | $24,030 |
| 2023 | $1,527 | $27,320 | $6,390 | $20,930 |
| 2022 | $1,409 | $24,800 | $5,800 | $19,000 |
| 2021 | $1,243 | $23,570 | $5,510 | $18,060 |
| 2020 | $1,195 | $22,800 | $5,330 | $17,470 |
| 2019 | $1,047 | $20,250 | $5,150 | $15,100 |
| 2018 | $1,018 | $19,100 | $4,860 | $14,240 |
| 2017 | $975 | $19,100 | $4,860 | $14,240 |
| 2016 | $1,051 | $19,100 | $4,860 | $14,240 |
| 2015 | $997 | $19,170 | $4,880 | $14,290 |
| 2014 | $997 | $19,170 | $4,880 | $14,290 |
| 2013 | $997 | $19,710 | $5,020 | $14,690 |
Source: Public Records
Map
Nearby Homes
- 2424 Angela Dr
- 2305 Clinton Dr
- 2345 Paul Ave
- 2608 Angela Dr
- 2152 Bern Ave
- 2216 Woodlawn Ave
- 2132 Orville Ave
- 2125 Lynch Ave
- 1732 Sycamore St
- 1608 Union Ave
- 4021 Sara St
- 2507 Morrison Rd
- 1633 Sycamore St
- 2614 Morrison Rd
- 1728 Ferguson Ave
- 17 Del Rio Ave
- 1737 Moro Ave
- 3401 Franklin Ave
- 1612 Venice Ave
- 50 Janday Ln