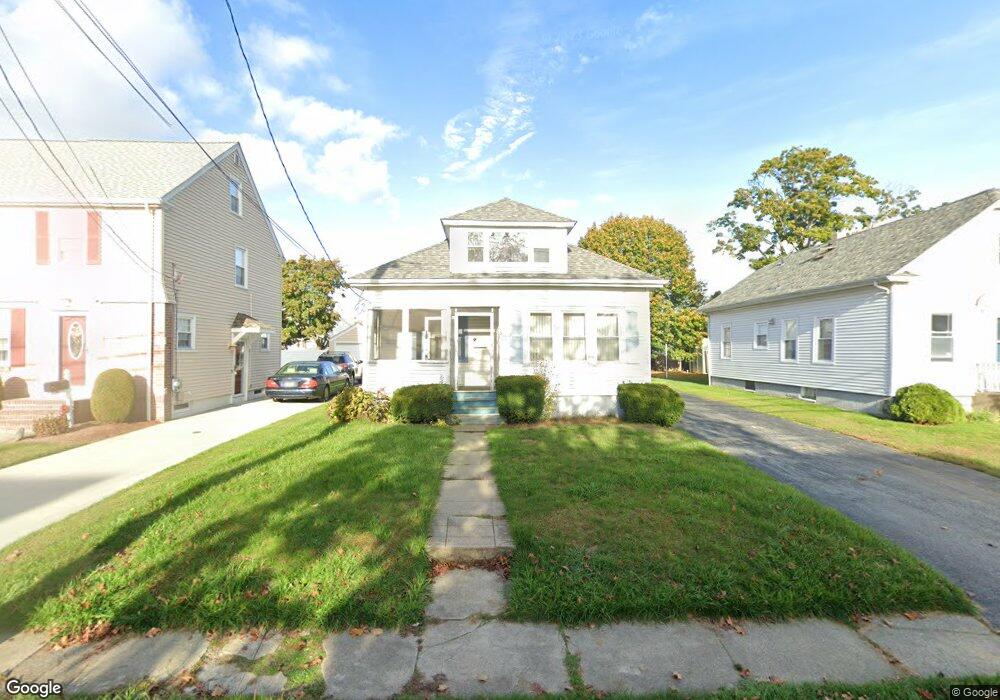
83 Richland Rd Cranston, RI 02910
Forest Hills NeighborhoodEstimated Value: $354,000 - $395,867
3
Beds
1
Bath
1,474
Sq Ft
$258/Sq Ft
Est. Value
About This Home
This home is located at 83 Richland Rd, Cranston, RI 02910 and is currently estimated at $380,967, approximately $258 per square foot. 83 Richland Rd is a home located in Providence County with nearby schools including Woodridge Elementary School, Western Hills Middle School, and Cranston High School West.
Ownership History
Date
Name
Owned For
Owner Type
Purchase Details
Closed on
Jun 5, 2024
Sold by
Marandola Eda
Bought by
Marandola Michael J
Current Estimated Value
Home Financials for this Owner
Home Financials are based on the most recent Mortgage that was taken out on this home.
Original Mortgage
$240,000
Outstanding Balance
$236,816
Interest Rate
7.17%
Mortgage Type
Purchase Money Mortgage
Estimated Equity
$144,151
Create a Home Valuation Report for This Property
The Home Valuation Report is an in-depth analysis detailing your home's value as well as a comparison with similar homes in the area
Home Values in the Area
Average Home Value in this Area
Purchase History
| Date | Buyer | Sale Price | Title Company |
|---|---|---|---|
| Marandola Michael J | $340,000 | None Available | |
| Marandola Michael J | $340,000 | None Available |
Source: Public Records
Mortgage History
| Date | Status | Borrower | Loan Amount |
|---|---|---|---|
| Open | Marandola Michael J | $240,000 | |
| Closed | Marandola Michael J | $240,000 |
Source: Public Records
Tax History Compared to Growth
Tax History
| Year | Tax Paid | Tax Assessment Tax Assessment Total Assessment is a certain percentage of the fair market value that is determined by local assessors to be the total taxable value of land and additions on the property. | Land | Improvement |
|---|---|---|---|---|
| 2025 | $4,179 | $301,100 | $106,700 | $194,400 |
| 2024 | $4,022 | $295,500 | $106,700 | $188,800 |
| 2023 | $3,882 | $205,400 | $73,600 | $131,800 |
| 2022 | $3,802 | $205,400 | $73,600 | $131,800 |
| 2021 | $3,697 | $205,400 | $73,600 | $131,800 |
| 2020 | $3,732 | $179,700 | $77,100 | $102,600 |
| 2019 | $3,732 | $179,700 | $77,100 | $102,600 |
| 2018 | $3,646 | $179,700 | $77,100 | $102,600 |
| 2017 | $3,269 | $142,500 | $70,100 | $72,400 |
| 2016 | $3,199 | $142,500 | $70,100 | $72,400 |
| 2015 | $3,199 | $142,500 | $70,100 | $72,400 |
| 2014 | $3,159 | $138,300 | $70,100 | $68,200 |
Source: Public Records
Map
Nearby Homes
- 55 Columbus Blvd
- 12 Stevens Rd
- 46 Roslyn Ave
- 130 Wollaston St
- 63 Packard St
- 74 Leslie St
- 80 Packard St
- 115 Norfolk St
- 210 Crescent Ave
- 140 Concord Ave
- 166 Midwood St
- 0 Fiat Ave
- 51 Norfolk St
- 111 Belgium St
- 75 High School Ave
- 145 Harmon Ave
- 174 Gansett Ave
- 41 Gleason St
- 136 Frankfort St
- 140 Eldridge St
- 79 Richland Rd
- 87 Richland Rd
- 75 Richland Rd
- 91 Richland Rd
- 108 Calaman Rd
- 77 Crothers Ave
- 98 Calaman Rd
- 71 Richland Rd
- 120 Calaman Rd
- 94 Calaman Rd
- 73 Crothers Ave
- 84 Richland Rd
- 80 Richland Rd
- 88 Richland Rd
- 122 Calaman Rd
- 68 Knollwood Ave
- 80 Knollwood Ave
- 76 Richland Rd
- 89 Crothers Ave
- 67 Crothers Ave