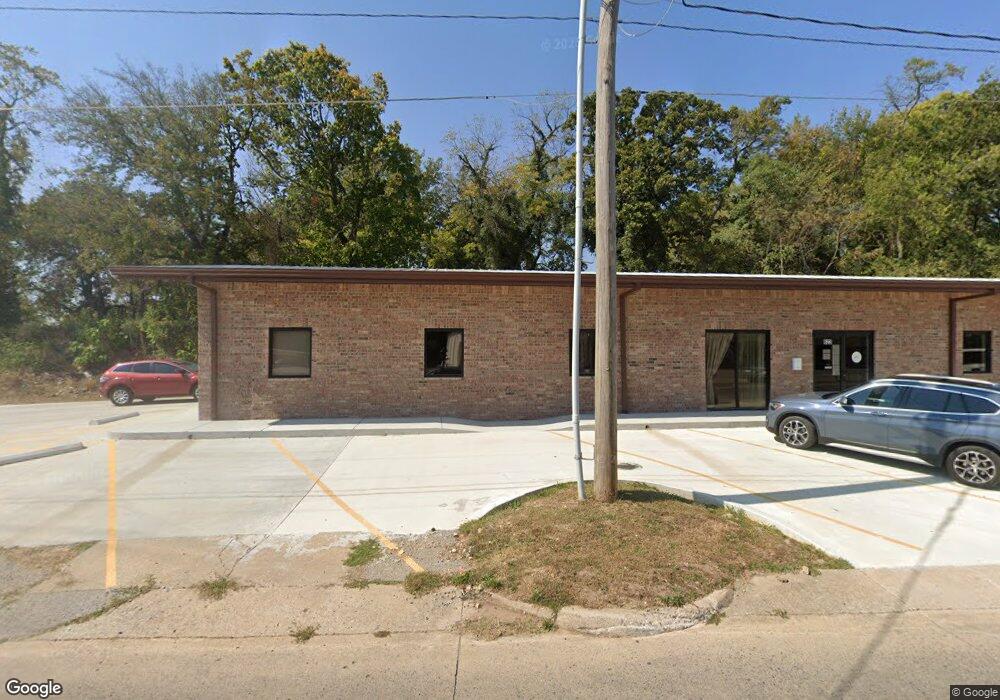
830 S Muskogee Ave Tahlequah, OK 74464
Estimated Value: $390,052
--
Bed
--
Bath
2,960
Sq Ft
$132/Sq Ft
Est. Value
About This Home
This home is located at 830 S Muskogee Ave, Tahlequah, OK 74464 and is currently estimated at $390,052, approximately $131 per square foot. 830 S Muskogee Ave is a home located in Cherokee County with nearby schools including Greenwood Elementary School, Cherokee Elementary School, and Tahlequah Middle School.
Ownership History
Date
Name
Owned For
Owner Type
Purchase Details
Closed on
Jul 10, 2023
Sold by
Guardian Holdings Llc
Bought by
Four D Real Estate Llc
Current Estimated Value
Purchase Details
Closed on
Dec 7, 2009
Sold by
Parrish Robert M and Parrish Cheryl J
Bought by
Guardian Holdings Llc
Home Financials for this Owner
Home Financials are based on the most recent Mortgage that was taken out on this home.
Original Mortgage
$202,440
Interest Rate
5.1%
Mortgage Type
Commercial
Purchase Details
Closed on
Oct 13, 2009
Sold by
Cragar Scott and Cragar Judith
Bought by
Parrish Robert M and Pariush Cheryl J
Home Financials for this Owner
Home Financials are based on the most recent Mortgage that was taken out on this home.
Original Mortgage
$202,440
Interest Rate
5.1%
Mortgage Type
Commercial
Create a Home Valuation Report for This Property
The Home Valuation Report is an in-depth analysis detailing your home's value as well as a comparison with similar homes in the area
Home Values in the Area
Average Home Value in this Area
Purchase History
| Date | Buyer | Sale Price | Title Company |
|---|---|---|---|
| Four D Real Estate Llc | $375,000 | Green Country Abstract & Title | |
| Guardian Holdings Llc | -- | None Available | |
| Parrish Robert M | $200,000 | None Available |
Source: Public Records
Mortgage History
| Date | Status | Borrower | Loan Amount |
|---|---|---|---|
| Previous Owner | Parrish Robert M | $202,440 |
Source: Public Records
Tax History Compared to Growth
Tax History
| Year | Tax Paid | Tax Assessment Tax Assessment Total Assessment is a certain percentage of the fair market value that is determined by local assessors to be the total taxable value of land and additions on the property. | Land | Improvement |
|---|---|---|---|---|
| 2025 | $3,921 | $41,988 | $8,250 | $33,738 |
| 2024 | $3,908 | $41,250 | $8,250 | $33,000 |
| 2023 | $3,908 | $19,786 | $6,418 | $13,368 |
| 2022 | $1,836 | $19,786 | $6,418 | $13,368 |
| 2021 | $1,802 | $19,347 | $6,275 | $13,072 |
| 2020 | $1,747 | $18,427 | $5,977 | $12,450 |
| 2019 | $1,649 | $17,548 | $5,692 | $11,856 |
| 2018 | $1,589 | $16,713 | $5,274 | $11,439 |
| 2017 | $1,510 | $15,916 | $5,506 | $10,410 |
| 2016 | $1,447 | $15,159 | $5,228 | $9,931 |
| 2015 | $1,355 | $14,437 | $5,084 | $9,353 |
| 2014 | $1,294 | $13,750 | $5,720 | $8,030 |
Source: Public Records
Map
Nearby Homes
- 802 S College Ave
- 757 S Bluff Ave
- 306 Short St
- 510 S Cherokee Ave
- 201 Sandy Cir
- 513 S State Ave
- 702 Wilson Ave
- 902 S Mission Ave
- 516 W Fox St
- 224 W Chickasaw St
- 413 Greenwood Dr
- 403 S Bluff Ave
- 902 S Owens Ave
- 508 Covington Place
- 1105 S Maple Ave
- 215 S Maple Ave
- 1290 E 4th St
- 605 S Oak Ave
- 215 E Fuller St
- 0 W Choctaw St
- 826 S Muskogee Ave
- 822 S Muskogee Ave
- 825 S Muskogee Ave
- 722 S Muskogee Ave
- 720 S Muskogee Ave
- 720 S College Ave
- 26.1 Tahlequah Hc 11
- 805 S College Ave
- 718 S College Ct
- 718 College Ct
- 706 S Muskogee Ave
- 811 S College Ave
- 809 S College Ave
- 807 S College Ave
- 909 S Muskogee Ave
- 709 S College Ave
- 711 S Muskogee Ave
- 801 S College Ave
- 17-1 Tahlequah Hc 11
- 109-1 NE Tahlequah Hc 11