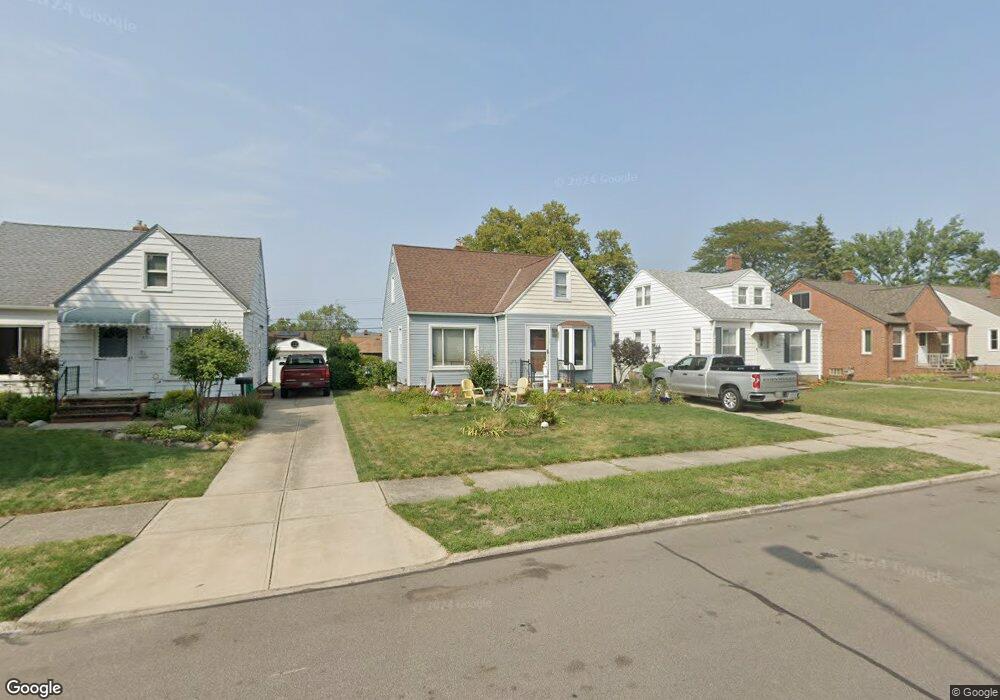
8306 Bertha Ave Cleveland, OH 44129
Estimated Value: $166,000 - $191,294
3
Beds
1
Bath
1,188
Sq Ft
$154/Sq Ft
Est. Value
About This Home
This home is located at 8306 Bertha Ave, Cleveland, OH 44129 and is currently estimated at $182,574, approximately $153 per square foot. 8306 Bertha Ave is a home located in Cuyahoga County with nearby schools including Renwood Elementary School, Thoreau Park Elementary School, and Greenbriar Middle School.
Ownership History
Date
Name
Owned For
Owner Type
Purchase Details
Closed on
Aug 3, 2010
Sold by
Minich Gregory E
Bought by
Minich Jennifer A
Current Estimated Value
Purchase Details
Closed on
Jul 26, 2006
Sold by
Hudak Christopher J and Hudak Jennifer L
Bought by
Minich Gregory E and Hudak Jennifer A
Home Financials for this Owner
Home Financials are based on the most recent Mortgage that was taken out on this home.
Original Mortgage
$113,477
Outstanding Balance
$68,019
Interest Rate
6.73%
Mortgage Type
FHA
Estimated Equity
$114,555
Purchase Details
Closed on
Apr 16, 1996
Sold by
Hudak Mathew J
Bought by
Hudak Christopher J and Breyley Jennifer L
Home Financials for this Owner
Home Financials are based on the most recent Mortgage that was taken out on this home.
Original Mortgage
$78,500
Interest Rate
7.46%
Mortgage Type
New Conventional
Purchase Details
Closed on
Apr 9, 1985
Sold by
Hudak Matthew and Hudak M
Bought by
Hudak Mary
Purchase Details
Closed on
Jan 1, 1975
Bought by
Hudak Matthew and Hudak M
Create a Home Valuation Report for This Property
The Home Valuation Report is an in-depth analysis detailing your home's value as well as a comparison with similar homes in the area
Home Values in the Area
Average Home Value in this Area
Purchase History
| Date | Buyer | Sale Price | Title Company |
|---|---|---|---|
| Minich Jennifer A | -- | None Available | |
| Minich Gregory E | $115,000 | Chicago Title Insurance C | |
| Hudak Christopher J | $86,000 | -- | |
| Hudak Mary | -- | -- | |
| Hudak Matthew | -- | -- |
Source: Public Records
Mortgage History
| Date | Status | Borrower | Loan Amount |
|---|---|---|---|
| Open | Minich Gregory E | $113,477 | |
| Closed | Hudak Christopher J | $78,500 |
Source: Public Records
Tax History Compared to Growth
Tax History
| Year | Tax Paid | Tax Assessment Tax Assessment Total Assessment is a certain percentage of the fair market value that is determined by local assessors to be the total taxable value of land and additions on the property. | Land | Improvement |
|---|---|---|---|---|
| 2024 | $3,337 | $52,675 | $12,530 | $40,145 |
| 2023 | $3,464 | $47,880 | $11,060 | $36,820 |
| 2022 | $3,432 | $47,880 | $11,060 | $36,820 |
| 2021 | $3,535 | $47,880 | $11,060 | $36,820 |
| 2020 | $3,026 | $36,820 | $8,510 | $28,320 |
| 2019 | $2,901 | $105,200 | $24,300 | $80,900 |
| 2018 | $2,918 | $36,820 | $8,510 | $28,320 |
| 2017 | $2,740 | $32,170 | $6,580 | $25,590 |
| 2016 | $2,694 | $31,780 | $6,580 | $25,200 |
| 2015 | $2,588 | $31,780 | $6,580 | $25,200 |
| 2014 | $2,588 | $32,450 | $6,720 | $25,730 |
Source: Public Records
Map
Nearby Homes
- 5906 Twin Lakes Dr
- 7615 Bertha Ave
- 5860 Pearl Rd
- 5972 Westminster Dr
- 7910 Dresden Ave
- 7514 Spring Garden Rd
- 5717 Chestnut Dr
- 7609 Wooster Pkwy
- 8514 Deerfield Dr
- 7115 Hampstead Ave
- 5845 Lotusdale Dr
- 6903 Alber Ave
- 7014 Thornton Dr
- 6818 Hampstead Ave
- 8221 Pelham Dr
- 7915 Fernhill Ave
- 9621 Elsmere Dr
- 6706 Alber Ave
- 6704 Charles Ave
- 6903 Forest Ave
- 8226 Bertha Ave
- 8310 Bertha Ave
- 8222 Bertha Ave
- 8218 Bertha Ave
- 8307 Essen Ave
- 8303 Essen Ave
- 5859 Chestnut Hills Dr
- 8319 Essen Ave
- 8223 Essen Ave
- 5853 Chestnut Hills Dr
- 8214 Bertha Ave
- 5875 Chestnut Hills Dr
- 8321 Essen Ave
- 8219 Essen Ave
- 8305 Bertha Ave
- 8221 Bertha Ave
- 8210 Bertha Ave
- 5879 Chestnut Hills Dr
- 8215 Essen Ave
- 5847 Chestnut Hills Dr