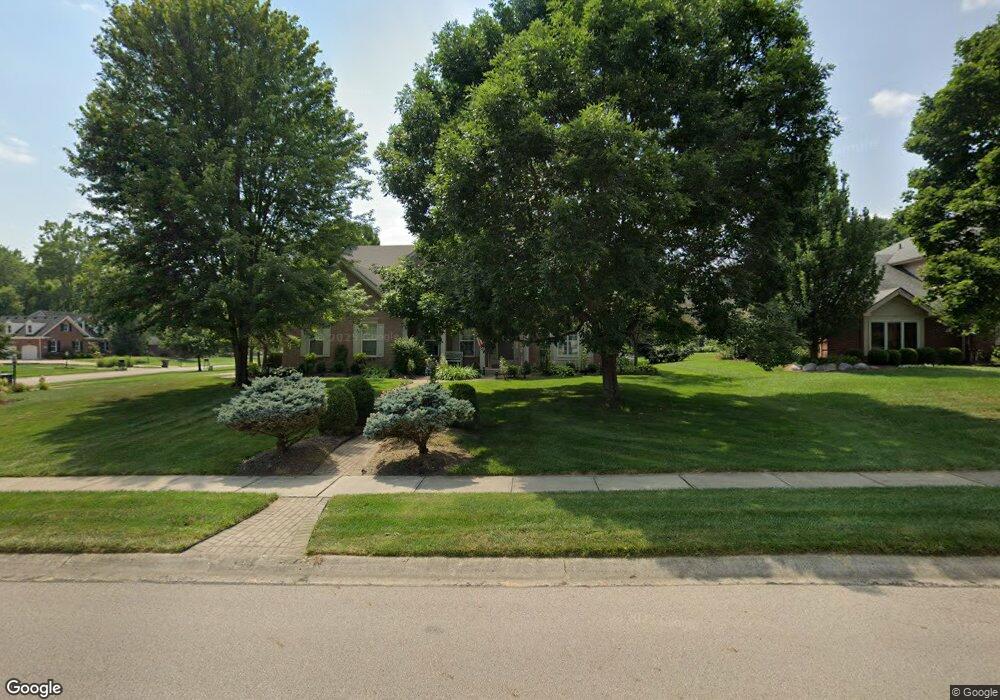
831 Kelsey Ct Dayton, OH 45458
Estimated Value: $596,915 - $651,000
4
Beds
4
Baths
3,522
Sq Ft
$176/Sq Ft
Est. Value
About This Home
This home is located at 831 Kelsey Ct, Dayton, OH 45458 and is currently estimated at $620,305, approximately $176 per square foot. 831 Kelsey Ct is a home located in Montgomery County with nearby schools including Primary Village South, Cline Elementary, and Tower Heights Middle School.
Ownership History
Date
Name
Owned For
Owner Type
Purchase Details
Closed on
Oct 7, 2016
Sold by
Hurtado Michael A and Hurtado Deann L
Bought by
Morrison Donald A and Morrison Lisa E
Current Estimated Value
Home Financials for this Owner
Home Financials are based on the most recent Mortgage that was taken out on this home.
Original Mortgage
$360,900
Outstanding Balance
$289,145
Interest Rate
3.44%
Mortgage Type
New Conventional
Estimated Equity
$331,160
Purchase Details
Closed on
Oct 14, 2002
Sold by
Drees Premier Homes Inc
Bought by
Hurtado Michael A and Hurtado Deann L
Home Financials for this Owner
Home Financials are based on the most recent Mortgage that was taken out on this home.
Original Mortgage
$300,700
Interest Rate
6.1%
Purchase Details
Closed on
Apr 26, 2002
Sold by
Sohan Gupta
Bought by
Drees Premier Homes Inc and Zaring Premier Homes
Purchase Details
Closed on
Jan 20, 1994
Sold by
Seasly Ross
Bought by
Gupta Sohan and Gupta Kusum
Create a Home Valuation Report for This Property
The Home Valuation Report is an in-depth analysis detailing your home's value as well as a comparison with similar homes in the area
Home Values in the Area
Average Home Value in this Area
Purchase History
| Date | Buyer | Sale Price | Title Company |
|---|---|---|---|
| Morrison Donald A | $379,900 | Home Services Title Llc | |
| Hurtado Michael A | $410,200 | Attorney Title Agency | |
| Drees Premier Homes Inc | $57,000 | -- | |
| Gupta Sohan | -- | -- |
Source: Public Records
Mortgage History
| Date | Status | Borrower | Loan Amount |
|---|---|---|---|
| Open | Morrison Donald A | $360,900 | |
| Previous Owner | Hurtado Michael A | $300,700 |
Source: Public Records
Tax History Compared to Growth
Tax History
| Year | Tax Paid | Tax Assessment Tax Assessment Total Assessment is a certain percentage of the fair market value that is determined by local assessors to be the total taxable value of land and additions on the property. | Land | Improvement |
|---|---|---|---|---|
| 2024 | $10,880 | $176,780 | $32,340 | $144,440 |
| 2023 | $10,880 | $176,780 | $32,340 | $144,440 |
| 2022 | $10,418 | $133,920 | $24,500 | $109,420 |
| 2021 | $10,446 | $133,920 | $24,500 | $109,420 |
| 2020 | $10,432 | $133,920 | $24,500 | $109,420 |
| 2019 | $11,672 | $133,920 | $24,500 | $109,420 |
| 2018 | $10,423 | $133,920 | $24,500 | $109,420 |
| 2017 | $11,016 | $143,380 | $24,500 | $118,880 |
| 2016 | $11,009 | $135,080 | $24,500 | $110,580 |
| 2015 | $10,831 | $135,080 | $24,500 | $110,580 |
| 2014 | $10,831 | $135,080 | $24,500 | $110,580 |
| 2012 | -- | $137,570 | $28,000 | $109,570 |
Source: Public Records
Map
Nearby Homes
- 8580 Hide a Way Ln
- 9139 Indian Springs Ct
- 35 Bywood Ct
- 1071 Star Valley Ct
- 9038 Woodstream Ln
- 9517 Moorgate Ct
- 9214 N Creek Ln
- 2006 Washington Creek Ln
- 1052 Quiet Brook Trail
- 694 Spring Ridge Place
- 1016 Quiet Brook Trail
- 8713 Woodglen Point
- 2044 Meadowside Ln
- 843 Clareridge Ln Unit 843
- 7820 Raintree Rd
- 121 Woodfield Place
- 40 Cemetery Dr
- 170 S Main St Unit C
- 1248 Timberhawk Trail
- 9354 Buckboard Dr