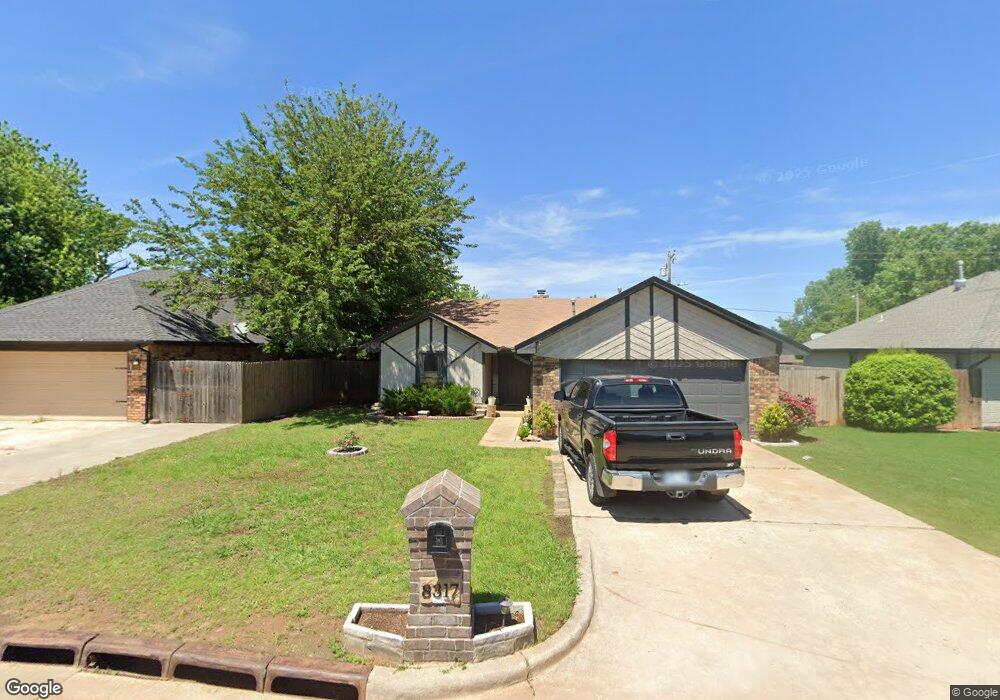
8317 SW 36th St Oklahoma City, OK 73179
Winds West NeighborhoodEstimated Value: $176,000 - $220,000
3
Beds
2
Baths
1,546
Sq Ft
$128/Sq Ft
Est. Value
About This Home
This home is located at 8317 SW 36th St, Oklahoma City, OK 73179 and is currently estimated at $197,751, approximately $127 per square foot. 8317 SW 36th St is a home located in Oklahoma County with nearby schools including Winds West Elementary School, Western Heights Middle School, and Western Heights High School.
Ownership History
Date
Name
Owned For
Owner Type
Purchase Details
Closed on
Jun 1, 2022
Sold by
Ars Okc Investments Llc
Bought by
Shared Dreams Llc
Current Estimated Value
Home Financials for this Owner
Home Financials are based on the most recent Mortgage that was taken out on this home.
Original Mortgage
$134,300
Outstanding Balance
$119,526
Interest Rate
4.31%
Mortgage Type
New Conventional
Estimated Equity
$78,225
Purchase Details
Closed on
May 31, 2022
Sold by
Ars Okc Investments Llc
Bought by
Shared Dreams Llc
Home Financials for this Owner
Home Financials are based on the most recent Mortgage that was taken out on this home.
Original Mortgage
$134,300
Outstanding Balance
$119,526
Interest Rate
4.31%
Mortgage Type
New Conventional
Estimated Equity
$78,225
Purchase Details
Closed on
Jun 19, 2019
Sold by
Wilson Charles E and Wilson Linda A
Bought by
Ars Okc Investments Llc
Purchase Details
Closed on
Jul 10, 2006
Sold by
Burks Angela K and Burks Randal S
Bought by
Wilson Charles E
Home Financials for this Owner
Home Financials are based on the most recent Mortgage that was taken out on this home.
Original Mortgage
$86,279
Interest Rate
6.44%
Mortgage Type
Purchase Money Mortgage
Create a Home Valuation Report for This Property
The Home Valuation Report is an in-depth analysis detailing your home's value as well as a comparison with similar homes in the area
Home Values in the Area
Average Home Value in this Area
Purchase History
| Date | Buyer | Sale Price | Title Company |
|---|---|---|---|
| Shared Dreams Llc | $130,000 | New Title Company Name | |
| Shared Dreams Llc | $130,000 | New Title Company Name | |
| Ars Okc Investments Llc | -- | None Available | |
| Wilson Charles E | $62,500 | None Available |
Source: Public Records
Mortgage History
| Date | Status | Borrower | Loan Amount |
|---|---|---|---|
| Open | Shared Dreams Llc | $134,300 | |
| Closed | Shared Dreams Llc | $134,300 | |
| Previous Owner | Wilson Charles E | $86,279 |
Source: Public Records
Tax History Compared to Growth
Tax History
| Year | Tax Paid | Tax Assessment Tax Assessment Total Assessment is a certain percentage of the fair market value that is determined by local assessors to be the total taxable value of land and additions on the property. | Land | Improvement |
|---|---|---|---|---|
| 2024 | $2,162 | $19,519 | $2,956 | $16,563 |
| 2023 | $2,162 | $18,590 | $3,140 | $15,450 |
| 2022 | $1,719 | $14,612 | $2,709 | $11,903 |
| 2021 | $1,680 | $13,917 | $2,710 | $11,207 |
| 2020 | $1,550 | $13,255 | $2,859 | $10,396 |
| 2019 | $1,580 | $13,340 | $2,819 | $10,521 |
| 2018 | $1,515 | $12,705 | $0 | $0 |
| 2017 | $1,490 | $12,539 | $2,614 | $9,925 |
| 2016 | $1,437 | $12,209 | $2,614 | $9,595 |
| 2015 | $1,429 | $12,045 | $2,614 | $9,431 |
| 2014 | $1,364 | $11,565 | $2,614 | $8,951 |
Source: Public Records
Map
Nearby Homes
- 3712 Summerwind Ave
- 3716 Western Heights Ave
- 3845 Southwind Ave
- 8508 SW 36th St
- 3325 S Lightner Ln
- 3744 Windswest Ct
- 3817 Windswest Ct
- 8609 SW 36 Terrace
- 8612 SW 36th Terrace
- 8701 SW 37th St
- 9320 SW 34th St
- 4405 Idyl Breeze Dr
- 5 Acres County Line Rd & Sw 44th
- 4400 Wind Haven Dr
- 4420 Idyl Breeze Dr
- 8808 SW 41 St
- 3901 Brougham Way
- 3916 Brougham Way
- 8820 SW 31st Terrace
- 8520 SW 44th Ct
- 8313 SW 36th St
- 8321 SW 36th St
- 8309 SW 36th St
- 3700 Summerwind Ct
- 8325 SW 36th St
- 3701 Summerwind Ave
- 8305 SW 36th St
- 3701 Summerwind Ct
- 3704 Summerwind Ct
- 3705 Summerwind Ave
- 3705 Summerwind Ct
- 8301 SW 36th St
- 3708 Summerwind Ct
- 3700 Summerwind Ave
- 3709 Summerwind Ct
- 3709 Summerwind Ave
- 3704 Summerwind Ave
- 8221 SW 36th St
- 8221 SW 36th St Unit 5802784095
- 3713 Summerwind Ct