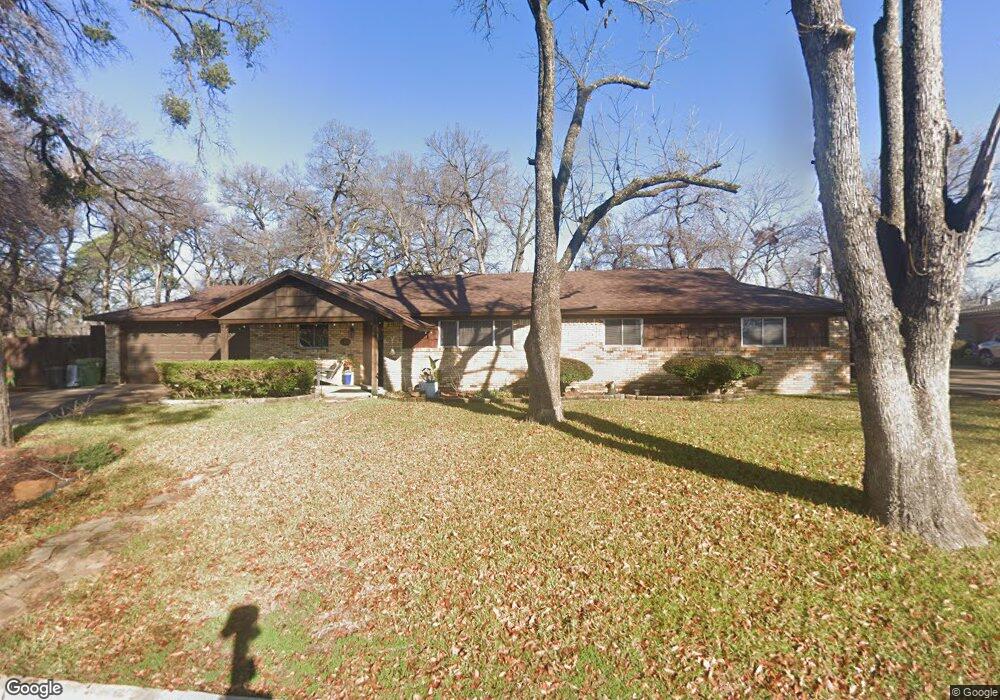
8325 Jerrie jo Dr North Richland Hills, TX 76180
Estimated Value: $306,000 - $343,000
3
Beds
2
Baths
1,701
Sq Ft
$186/Sq Ft
Est. Value
About This Home
This home is located at 8325 Jerrie jo Dr, North Richland Hills, TX 76180 and is currently estimated at $315,572, approximately $185 per square foot. 8325 Jerrie jo Dr is a home located in Tarrant County with nearby schools including Jack C Binion Elementary School, Richland Middle School, and Birdville High School.
Ownership History
Date
Name
Owned For
Owner Type
Purchase Details
Closed on
Aug 29, 2025
Sold by
Irby Randolph P
Bought by
Aquino Janice V
Current Estimated Value
Purchase Details
Closed on
Nov 16, 2012
Sold by
Simmons Anthony H and Simmons Lisa D
Bought by
Winnett William E
Home Financials for this Owner
Home Financials are based on the most recent Mortgage that was taken out on this home.
Original Mortgage
$104,080
Interest Rate
3.37%
Mortgage Type
FHA
Purchase Details
Closed on
Aug 13, 1999
Sold by
Green Robert Michael and Green Teresa Ann
Bought by
Simmons Anthony H and Simmons Lisa D
Home Financials for this Owner
Home Financials are based on the most recent Mortgage that was taken out on this home.
Original Mortgage
$92,434
Interest Rate
7.71%
Mortgage Type
FHA
Purchase Details
Closed on
Apr 28, 1995
Sold by
Woodruff Billye P and Parrish Doniece
Bought by
Green Robert M
Home Financials for this Owner
Home Financials are based on the most recent Mortgage that was taken out on this home.
Original Mortgage
$54,150
Interest Rate
8.33%
Create a Home Valuation Report for This Property
The Home Valuation Report is an in-depth analysis detailing your home's value as well as a comparison with similar homes in the area
Home Values in the Area
Average Home Value in this Area
Purchase History
| Date | Buyer | Sale Price | Title Company |
|---|---|---|---|
| Aquino Janice V | -- | None Listed On Document | |
| Winnett William E | -- | Capital Title | |
| Simmons Anthony H | -- | American Title Co | |
| Green Robert M | -- | Commonwealth Land Title |
Source: Public Records
Mortgage History
| Date | Status | Borrower | Loan Amount |
|---|---|---|---|
| Previous Owner | Winnett William E | $104,080 | |
| Previous Owner | Simmons Anthony H | $92,434 | |
| Previous Owner | Green Robert M | $54,150 |
Source: Public Records
Tax History Compared to Growth
Tax History
| Year | Tax Paid | Tax Assessment Tax Assessment Total Assessment is a certain percentage of the fair market value that is determined by local assessors to be the total taxable value of land and additions on the property. | Land | Improvement |
|---|---|---|---|---|
| 2025 | $3,769 | $248,865 | $122,952 | $125,913 |
| 2024 | $3,769 | $248,865 | $122,952 | $125,913 |
| 2023 | $5,655 | $267,605 | $122,952 | $144,653 |
| 2022 | $5,639 | $244,715 | $122,952 | $121,763 |
| 2021 | $5,421 | $213,049 | $35,000 | $178,049 |
| 2020 | $5,067 | $199,116 | $35,000 | $164,116 |
| 2019 | $4,088 | $195,414 | $29,750 | $165,664 |
| 2018 | $3,229 | $141,141 | $29,750 | $111,391 |
| 2017 | $3,452 | $175,617 | $29,750 | $145,867 |
| 2016 | $3,138 | $159,000 | $19,550 | $139,450 |
| 2015 | $2,286 | $166,437 | $19,550 | $146,887 |
| 2014 | $2,286 | $96,400 | $19,125 | $77,275 |
Source: Public Records
Map
Nearby Homes
- 5016 Wyoming Trail
- 5020 Colorado Blvd
- 5304 Colorado Blvd
- 8020 Laura St
- 5113 Bob Dr
- 8417 Emerald Cir
- 8304 Emerald Cir
- 1230 Wooded Trail
- 1230 Woodland Park Dr
- 1218 Wooded Trail
- 1220 Woodland Park Dr
- 7908 Lazy Lane Rd
- 823 W Harwood Rd
- 853 Royal Terrace
- 5336 Davis Blvd
- 1204 Princess Ln
- 6001 Kessler Dr
- 7717 Janetta Dr
- 6008 Kessler Dr
- 1016 Billie Ruth Ln
- 8329 Jerrie jo Dr
- 8320 Dude Ct
- 8321 Jerrie jo Dr
- 8330 Jerrie jo Dr
- 8320 Jerrie jo Dr
- 5109 Jennings Dr
- 8316 Jerrie jo Dr
- 5116 Jennings Dr
- 5101 Jennings Dr
- 5108 Pearl Dr
- 5112 Pearl Dr
- 5120 Jennings Dr
- 5104 Pearl Dr
- 5100 Pearl Dr
- 5120 Pearl Dr
- 5121 Jennings Dr
- 8308 Jerrie jo Dr
- 5124 Jennings Dr
- 8304 Jerrie jo Dr
- 5125 Jennings Dr