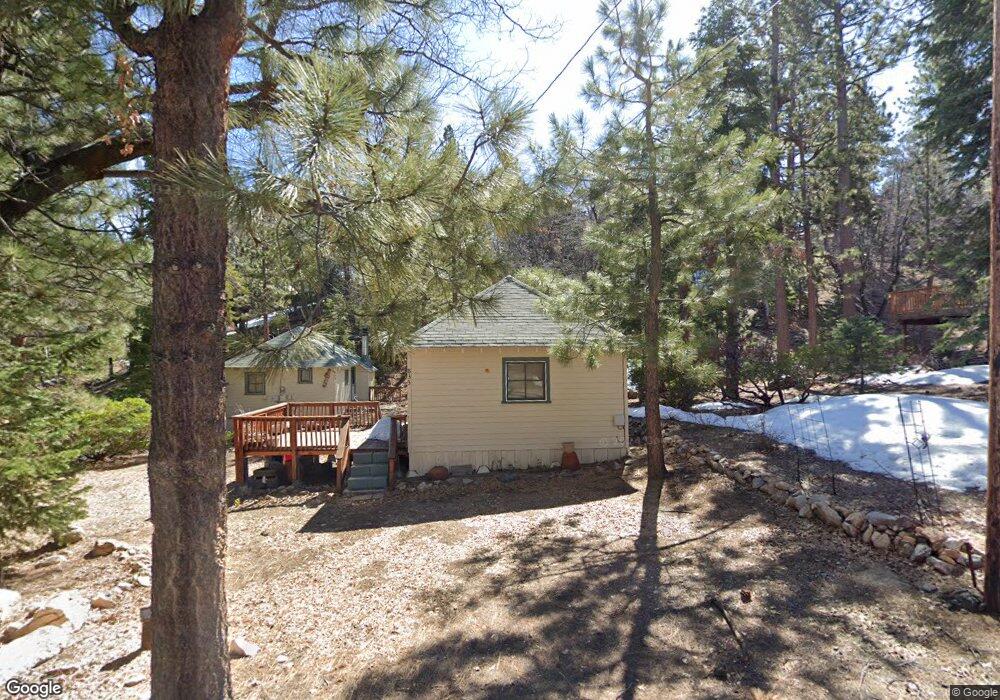
833 Georgia St Big Bear Lake, CA 92315
Estimated Value: $244,646 - $414,000
2
Beds
2
Baths
640
Sq Ft
$546/Sq Ft
Est. Value
About This Home
This home is located at 833 Georgia St, Big Bear Lake, CA 92315 and is currently estimated at $349,662, approximately $546 per square foot. 833 Georgia St is a home with nearby schools including Big Bear Middle School and Big Bear High School.
Ownership History
Date
Name
Owned For
Owner Type
Purchase Details
Closed on
Nov 30, 2002
Sold by
Psaltis James and Psaltis Mary Lou
Bought by
Psaltis James and Psaltis Mary Lou
Current Estimated Value
Purchase Details
Closed on
Dec 16, 1999
Sold by
Sandy Barrie E & Margaret A Trs
Bought by
Psaltis James and Psaltis Mary Lou
Purchase Details
Closed on
Jan 31, 1998
Sold by
Sandy Barrie E and Sandy Margaret A
Bought by
Sandy Barrie E and Sandy Margaret A
Purchase Details
Closed on
Aug 22, 1997
Sold by
Psaltis James and Psaltis Barrie
Bought by
Sandy Barrie and Sandy Margaret
Create a Home Valuation Report for This Property
The Home Valuation Report is an in-depth analysis detailing your home's value as well as a comparison with similar homes in the area
Home Values in the Area
Average Home Value in this Area
Purchase History
| Date | Buyer | Sale Price | Title Company |
|---|---|---|---|
| Psaltis James | -- | -- | |
| Psaltis James | -- | -- | |
| Sandy Barrie E | -- | -- | |
| Sandy Barrie E | -- | -- | |
| Sandy Barrie | -- | -- |
Source: Public Records
Tax History Compared to Growth
Tax History
| Year | Tax Paid | Tax Assessment Tax Assessment Total Assessment is a certain percentage of the fair market value that is determined by local assessors to be the total taxable value of land and additions on the property. | Land | Improvement |
|---|---|---|---|---|
| 2025 | $2,120 | $82,069 | $31,307 | $50,762 |
| 2024 | $2,120 | $80,460 | $30,693 | $49,767 |
| 2023 | $1,989 | $78,882 | $30,091 | $48,791 |
| 2022 | $1,839 | $77,335 | $29,501 | $47,834 |
| 2021 | $1,746 | $75,819 | $28,923 | $46,896 |
| 2020 | $1,736 | $75,041 | $28,626 | $46,415 |
| 2019 | $1,702 | $73,570 | $28,065 | $45,505 |
| 2018 | $1,647 | $72,128 | $27,515 | $44,613 |
| 2017 | $1,595 | $70,713 | $26,975 | $43,738 |
| 2016 | $1,560 | $69,326 | $26,446 | $42,880 |
| 2015 | $1,546 | $68,285 | $26,049 | $42,236 |
| 2014 | $1,525 | $66,948 | $25,539 | $41,409 |
Source: Public Records
Map
Nearby Homes