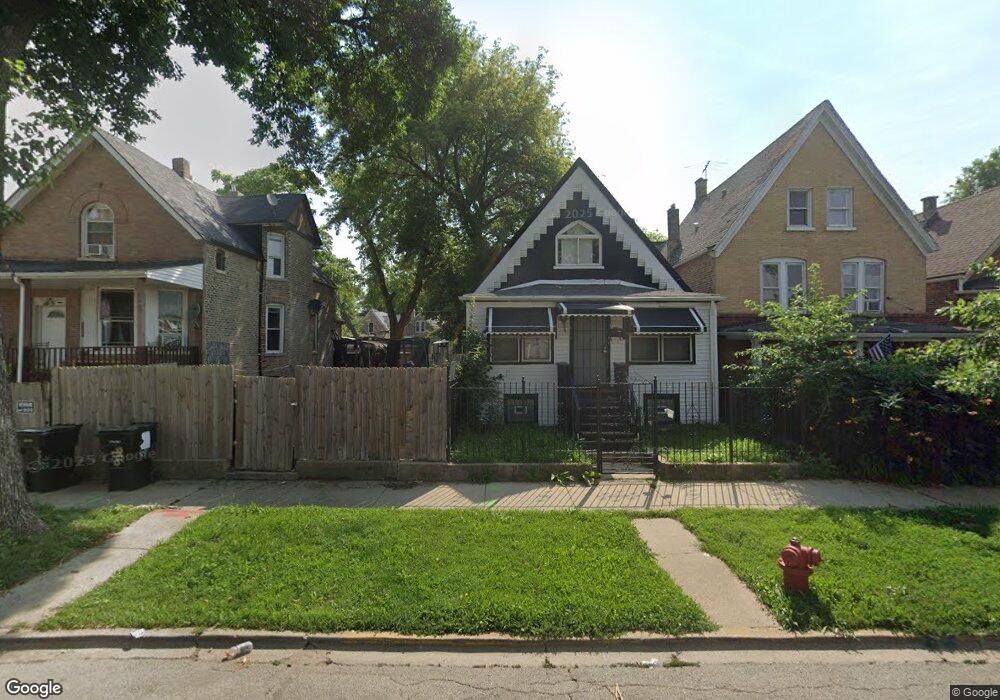
833 N Saint Louis Ave Chicago, IL 60651
Humboldt Park NeighborhoodEstimated Value: $252,549 - $506,000
4
Beds
1
Bath
1,111
Sq Ft
$341/Sq Ft
Est. Value
About This Home
This home is located at 833 N Saint Louis Ave, Chicago, IL 60651 and is currently estimated at $379,275, approximately $341 per square foot. 833 N Saint Louis Ave is a home located in Cook County with nearby schools including Orr Academy High School, KIPP One Academy, and Polaris Elementary Charter Academy.
Ownership History
Date
Name
Owned For
Owner Type
Purchase Details
Closed on
Jan 17, 2025
Sold by
Cook County Land Bank Authority and County Of Cook
Bought by
Montesdeoca Henry and Montesdeoca Maria
Current Estimated Value
Home Financials for this Owner
Home Financials are based on the most recent Mortgage that was taken out on this home.
Original Mortgage
$20,000
Interest Rate
6.96%
Mortgage Type
Seller Take Back
Purchase Details
Closed on
Jul 25, 2024
Sold by
Giles Cedric
Bought by
Sharrow Caitlyn
Purchase Details
Closed on
Mar 23, 2005
Sold by
Gomez Isabel
Bought by
Morales Veronica
Home Financials for this Owner
Home Financials are based on the most recent Mortgage that was taken out on this home.
Original Mortgage
$162,000
Interest Rate
7.4%
Mortgage Type
Unknown
Purchase Details
Closed on
Oct 4, 2004
Sold by
River Group Inc
Bought by
Gomez Isabel
Purchase Details
Closed on
Jul 19, 2004
Sold by
Emc Mortgage Corp
Bought by
River Group Inc
Purchase Details
Closed on
Jun 4, 2004
Sold by
Thompson Jessie
Bought by
Bankers Trust Co
Create a Home Valuation Report for This Property
The Home Valuation Report is an in-depth analysis detailing your home's value as well as a comparison with similar homes in the area
Home Values in the Area
Average Home Value in this Area
Purchase History
| Date | Buyer | Sale Price | Title Company |
|---|---|---|---|
| Montesdeoca Henry | -- | Chicago Title | |
| Sharrow Caitlyn | -- | None Listed On Document | |
| Morales Veronica | $180,000 | Heritage Title Company | |
| Gomez Isabel | $95,000 | -- | |
| River Group Inc | $75,000 | Cti | |
| Bankers Trust Co | -- | -- |
Source: Public Records
Mortgage History
| Date | Status | Borrower | Loan Amount |
|---|---|---|---|
| Previous Owner | Montesdeoca Henry | $20,000 | |
| Previous Owner | Morales Veronica | $162,000 |
Source: Public Records
Tax History Compared to Growth
Tax History
| Year | Tax Paid | Tax Assessment Tax Assessment Total Assessment is a certain percentage of the fair market value that is determined by local assessors to be the total taxable value of land and additions on the property. | Land | Improvement |
|---|---|---|---|---|
| 2024 | $992 | $5,781 | $5,781 | -- |
| 2023 | $964 | $4,688 | $4,688 | -- |
| 2022 | $964 | $4,688 | $4,688 | $0 |
| 2021 | $943 | $4,687 | $4,687 | $0 |
| 2020 | $818 | $3,671 | $3,671 | $0 |
| 2019 | $738 | $3,671 | $3,671 | $0 |
| 2018 | $725 | $3,671 | $3,671 | $0 |
| 2017 | $2,918 | $13,553 | $3,281 | $10,272 |
| 2016 | $2,715 | $13,553 | $3,281 | $10,272 |
| 2015 | $2,484 | $13,553 | $3,281 | $10,272 |
| 2014 | $2,180 | $11,751 | $3,125 | $8,626 |
| 2013 | $2,137 | $11,751 | $3,125 | $8,626 |
Source: Public Records
Map
Nearby Homes
- 905 N Saint Louis Ave
- 3546 W Chicago Ave
- 937 N Saint Louis Ave
- 922 N Homan Ave
- 903 N Homan Ave
- 725 N Trumbull Ave
- 913 N Homan Ave
- 948 N Homan Ave
- 943 N Central Park Ave
- 3518 W Augusta Blvd
- 1010 N Trumbull Ave
- 820 N Monticello Ave
- 741 N Christiana Ave
- 1023 N Saint Louis Ave
- 648 N Drake Ave
- 650 N Homan Ave
- 646 N Homan Ave
- 932 N Monticello Ave
- 3345 W Huron St
- 1047 N Saint Louis Ave
- 835 N Saint Louis Ave
- 831 N Saint Louis Ave
- 827 N Saint Louis Ave
- 827 N Saint Louis Ave
- 837 N Saint Louis Ave
- 839 N Saint Louis Ave
- 825 N Saint Louis Ave
- 843 N Saint Louis Ave
- 843 N St Louis Ave
- 845 N Saint Louis Ave
- 836 N Saint Louis Ave
- 826 N Saint Louis Ave
- 847 N Saint Louis Ave
- 832 N Saint Louis Ave
- 834 N Saint Louis Ave
- 834 N Trumbull Ave
- 828 N Trumbull Ave
- 836 N Trumbull Ave
- 826 N Trumbull Ave
- 840 N Saint Louis Ave