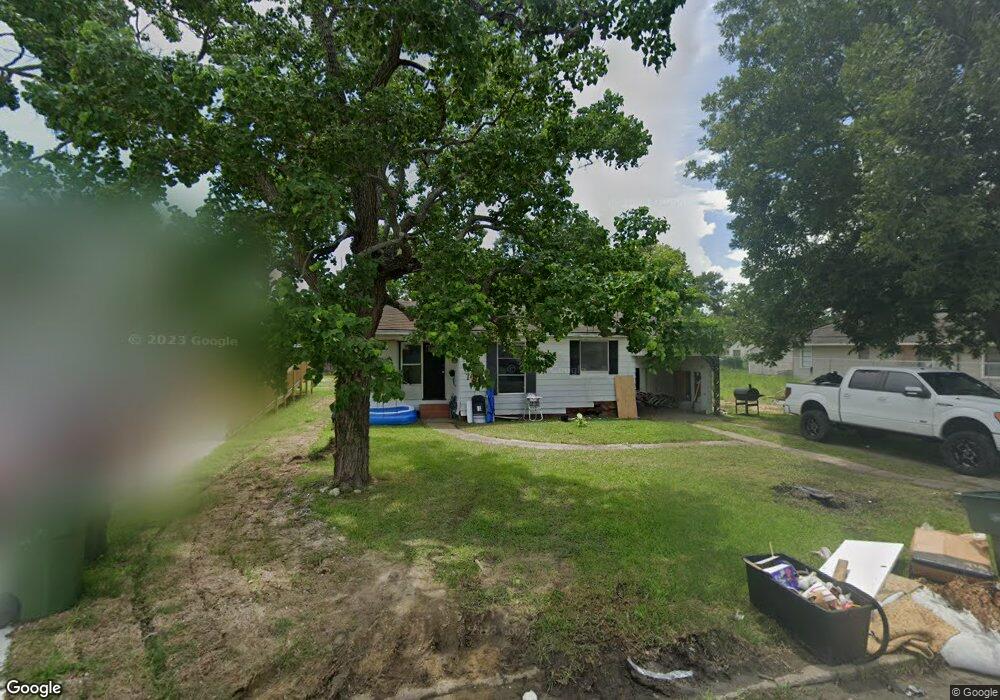
833 Rio Grande Ave Port Arthur, TX 77642
Estimated Value: $70,000 - $78,449
--
Bed
--
Bath
915
Sq Ft
$81/Sq Ft
Est. Value
About This Home
This home is located at 833 Rio Grande Ave, Port Arthur, TX 77642 and is currently estimated at $73,862, approximately $80 per square foot. 833 Rio Grande Ave is a home located in Jefferson County with nearby schools including Lakeview Elementary School, Jefferson Middle School, and Memorial High School.
Ownership History
Date
Name
Owned For
Owner Type
Purchase Details
Closed on
May 31, 2022
Sold by
219 Marshall Llc
Bought by
Pasadena Addition
Current Estimated Value
Home Financials for this Owner
Home Financials are based on the most recent Mortgage that was taken out on this home.
Original Mortgage
$46,499
Interest Rate
4.67%
Mortgage Type
Seller Take Back
Purchase Details
Closed on
Apr 1, 2022
Sold by
219 Marshall Llc
Bought by
Pasadena Addition
Home Financials for this Owner
Home Financials are based on the most recent Mortgage that was taken out on this home.
Original Mortgage
$46,499
Interest Rate
4.67%
Mortgage Type
Seller Take Back
Purchase Details
Closed on
Dec 1, 2020
Sold by
Williams Louis and Jefferson County
Bought by
210 Marshall Llc
Purchase Details
Closed on
Mar 2, 2004
Sold by
Robinson Charles Theodore and Robinson Richard
Bought by
Williams Louis and Williams Edna W
Create a Home Valuation Report for This Property
The Home Valuation Report is an in-depth analysis detailing your home's value as well as a comparison with similar homes in the area
Home Values in the Area
Average Home Value in this Area
Purchase History
| Date | Buyer | Sale Price | Title Company |
|---|---|---|---|
| Pasadena Addition | -- | None Listed On Document | |
| Pasadena Addition | -- | None Listed On Document | |
| Guzman Johany Stephanie Ra | -- | None Listed On Document | |
| 210 Marshall Llc | $20,814 | None Available | |
| Williams Louis | -- | -- |
Source: Public Records
Mortgage History
| Date | Status | Borrower | Loan Amount |
|---|---|---|---|
| Previous Owner | Guzman Johany Stephanie Ra | $46,499 |
Source: Public Records
Tax History Compared to Growth
Tax History
| Year | Tax Paid | Tax Assessment Tax Assessment Total Assessment is a certain percentage of the fair market value that is determined by local assessors to be the total taxable value of land and additions on the property. | Land | Improvement |
|---|---|---|---|---|
| 2025 | $1,947 | $59,426 | $6,750 | $52,676 |
| 2024 | $1,947 | $67,974 | $2,425 | $65,549 |
| 2023 | $1,947 | $67,974 | $2,425 | $65,549 |
| 2022 | $1,564 | $49,246 | $2,425 | $46,821 |
| 2021 | $1,341 | $40,467 | $2,425 | $38,042 |
| 2020 | $792 | $24,442 | $2,425 | $22,017 |
| 2019 | $662 | $20,780 | $2,430 | $18,350 |
| 2018 | $662 | $20,780 | $2,430 | $18,350 |
| 2017 | $644 | $20,780 | $2,430 | $18,350 |
| 2016 | $609 | $20,780 | $2,430 | $18,350 |
| 2015 | $620 | $20,780 | $2,430 | $18,350 |
| 2014 | $620 | $20,780 | $2,430 | $18,350 |
Source: Public Records
Map
Nearby Homes
- 1349 Jefferson Dr
- 4600 Lakeshore Dr
- 0 5th St
- 3945 12th St
- 4015 Lakeshore Dr
- 4100 Dryden Rd
- 2129 Neches Ave
- 3737 Lakeshore Dr
- 2515 Glenwood Dr
- 3512 7th St
- 1529 Main Ave
- 6121 13th St
- 248 Avant Ln
- 300 Dodge Place
- 3401 6th St
- 2434 Crescent Dr
- LOT 55 Royal Meadows Estate
- 2621 Evergreen Dr
- 3326 Thomas Blvd
- 000 16th St
- 839 Rio Grande Ave
- 829 Rio Grande Ave
- 849 Rio Grande Ave
- 849 Rio Grande Ave Unit 1
- 819 Rio Grande Ave
- 830 Pecos Ave
- 834 Pecos Ave
- 820 Pecos Ave
- 813 Rio Grande Ave
- 819 Stadium Rd
- 848 Pecos Ave
- 818 Pecos Ave
- 827 Stadium Rd
- 841 Stadium Rd
- 805 Rio Grande Ave
- 901 Rio Grande Ave
- 812 Pecos Ave
- 849 Stadium Rd
- 801 Rio Grande Ave
- 806 Pecos Ave