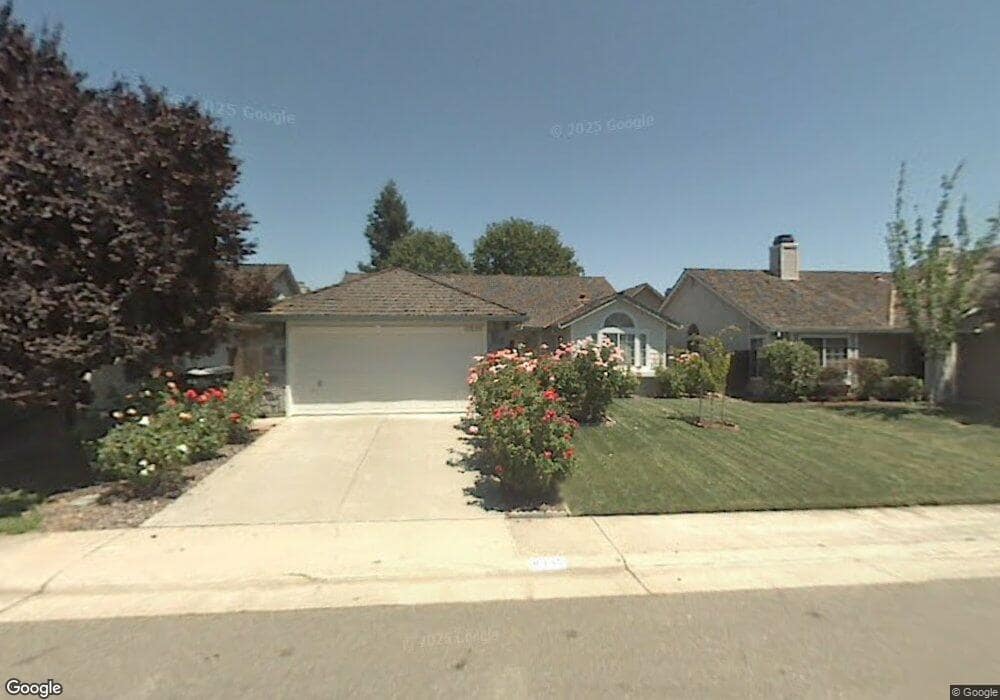
8335 Triad Cir Sacramento, CA 95828
Estimated Value: $416,000 - $487,000
3
Beds
2
Baths
1,372
Sq Ft
$333/Sq Ft
Est. Value
About This Home
This home is located at 8335 Triad Cir, Sacramento, CA 95828 and is currently estimated at $456,666, approximately $332 per square foot. 8335 Triad Cir is a home located in Sacramento County with nearby schools including Isabelle Jackson Elementary School, Edward Harris Jr. Middle School, and Monterey Trail High School.
Ownership History
Date
Name
Owned For
Owner Type
Purchase Details
Closed on
Nov 15, 2000
Sold by
Divoky David G and Divoky Lynn E
Bought by
Alexander Arputham A and Alexander Grace E
Current Estimated Value
Home Financials for this Owner
Home Financials are based on the most recent Mortgage that was taken out on this home.
Original Mortgage
$156,403
Outstanding Balance
$57,385
Interest Rate
7.82%
Mortgage Type
FHA
Estimated Equity
$399,281
Purchase Details
Closed on
Jun 5, 1997
Sold by
Gudeman Elbrecht Brian T and Gudeman Cynthia A
Bought by
Divoky David G and Divoky Lynn E
Home Financials for this Owner
Home Financials are based on the most recent Mortgage that was taken out on this home.
Original Mortgage
$85,500
Interest Rate
5.7%
Create a Home Valuation Report for This Property
The Home Valuation Report is an in-depth analysis detailing your home's value as well as a comparison with similar homes in the area
Home Values in the Area
Average Home Value in this Area
Purchase History
| Date | Buyer | Sale Price | Title Company |
|---|---|---|---|
| Alexander Arputham A | $157,500 | First American Title Ins Co | |
| Divoky David G | $90,000 | Commonwealth Land Title Co |
Source: Public Records
Mortgage History
| Date | Status | Borrower | Loan Amount |
|---|---|---|---|
| Open | Alexander Arputham A | $156,403 | |
| Previous Owner | Divoky David G | $85,500 |
Source: Public Records
Tax History Compared to Growth
Tax History
| Year | Tax Paid | Tax Assessment Tax Assessment Total Assessment is a certain percentage of the fair market value that is determined by local assessors to be the total taxable value of land and additions on the property. | Land | Improvement |
|---|---|---|---|---|
| 2025 | $2,723 | $237,224 | $42,178 | $195,046 |
| 2024 | $2,723 | $232,573 | $41,351 | $191,222 |
| 2023 | $2,658 | $228,014 | $40,541 | $187,473 |
| 2022 | $2,615 | $223,545 | $39,747 | $183,798 |
| 2021 | $2,588 | $219,163 | $38,968 | $180,195 |
| 2020 | $2,556 | $216,917 | $38,569 | $178,348 |
| 2019 | $2,512 | $212,664 | $37,813 | $174,851 |
| 2018 | $2,448 | $208,495 | $37,072 | $171,423 |
| 2017 | $2,409 | $204,408 | $36,346 | $168,062 |
| 2016 | $2,294 | $200,401 | $35,634 | $164,767 |
| 2015 | $2,254 | $197,392 | $35,099 | $162,293 |
| 2014 | $2,219 | $193,526 | $34,412 | $159,114 |
Source: Public Records
Map
Nearby Homes
- 8336 Cutler Way
- 8317 Honeycomb Way
- 8437 Yermo Way
- 8329 Spengler Dr
- 8251 Apple Cove Ct
- 8346 Floxtree Ct
- 8186 Gustine Way
- 8233 Short Rd
- 7905 Springarden Way
- 8077 Goran Ct
- 8216 Exbourne Cir
- 8510 Cavendish Way
- 8159 Morgan Hill Way
- 8336 Summer Sunset Dr
- 8266 Summer Sunset Dr
- 8282 Union Creek Way
- 7901 Stevenson Ave
- 8548 Whitby Ct
- 8578 Hydrangea Ct
- 8095 E Stockton Blvd
- 8331 Triad Cir
- 8339 Triad Cir
- 8340 Alpinmead Cir
- 8343 Triad Cir
- 8344 Alpinmead Cir
- 8336 Alpinmead Cir
- 8324 Triad Cir
- 8348 Alpinmead Cir
- 8354 Triad Cir
- 8320 Triad Cir
- 8347 Triad Cir
- 8358 Triad Cir
- 8352 Alpinmead Cir
- 8329 Alpinmead Cir
- 8361 Alpinmead Cir
- 8351 Triad Cir
- 8336 Trimmer Way
- 8332 Trimmer Way
- 8316 Triad Cir
- 8340 Trimmer Way