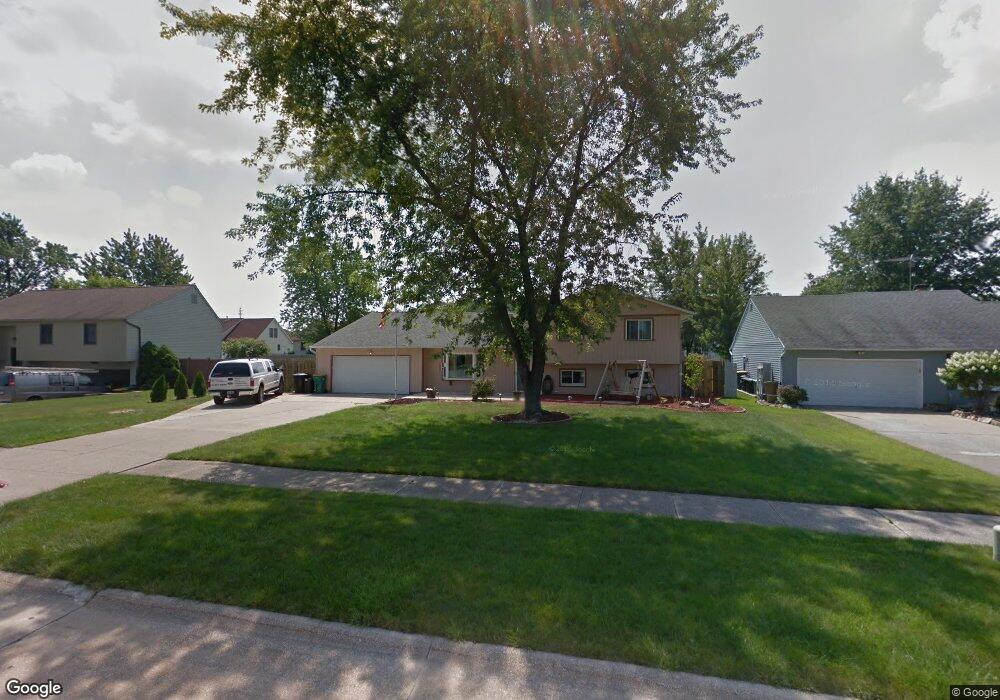
8368 Dallas Dr Mentor, OH 44060
Estimated Value: $300,000 - $339,528
3
Beds
3
Baths
1,509
Sq Ft
$214/Sq Ft
Est. Value
About This Home
This home is located at 8368 Dallas Dr, Mentor, OH 44060 and is currently estimated at $323,382, approximately $214 per square foot. 8368 Dallas Dr is a home located in Lake County with nearby schools including Fairfax Elementary School, Memorial Middle School, and Mentor High School.
Ownership History
Date
Name
Owned For
Owner Type
Purchase Details
Closed on
Nov 2, 2009
Sold by
Rotert Robert R and Rotert Dawna D
Bought by
Rotert Robert and Rotert Dawna
Current Estimated Value
Purchase Details
Closed on
Jan 28, 2002
Sold by
Anthony Lampert and Anthony Christine A
Bought by
Rotert Robert R and Rotert Dawna D
Home Financials for this Owner
Home Financials are based on the most recent Mortgage that was taken out on this home.
Original Mortgage
$163,415
Outstanding Balance
$68,524
Interest Rate
7.26%
Mortgage Type
FHA
Estimated Equity
$254,858
Purchase Details
Closed on
Nov 7, 1998
Sold by
Ropos Ronald P and Ropos Deborah M
Bought by
Lampert Anthony and Lampert Christine A
Home Financials for this Owner
Home Financials are based on the most recent Mortgage that was taken out on this home.
Original Mortgage
$115,600
Interest Rate
6.59%
Purchase Details
Closed on
May 14, 1990
Bought by
Ropos Ronald P
Create a Home Valuation Report for This Property
The Home Valuation Report is an in-depth analysis detailing your home's value as well as a comparison with similar homes in the area
Home Values in the Area
Average Home Value in this Area
Purchase History
| Date | Buyer | Sale Price | Title Company |
|---|---|---|---|
| Rotert Robert | -- | Attorney | |
| Rotert Robert R | $166,000 | Main Street Title Agency Inc | |
| Lampert Anthony | $144,500 | Midland Title Security Inc | |
| Ropos Ronald P | $97,000 | -- |
Source: Public Records
Mortgage History
| Date | Status | Borrower | Loan Amount |
|---|---|---|---|
| Open | Rotert Robert R | $163,415 | |
| Closed | Lampert Anthony | $115,600 |
Source: Public Records
Tax History Compared to Growth
Tax History
| Year | Tax Paid | Tax Assessment Tax Assessment Total Assessment is a certain percentage of the fair market value that is determined by local assessors to be the total taxable value of land and additions on the property. | Land | Improvement |
|---|---|---|---|---|
| 2024 | -- | $100,190 | $24,790 | $75,400 |
| 2023 | $8,015 | $77,130 | $17,560 | $59,570 |
| 2022 | $3,645 | $77,130 | $17,560 | $59,570 |
| 2021 | $3,641 | $77,130 | $17,560 | $59,570 |
| 2020 | $3,524 | $65,360 | $14,880 | $50,480 |
| 2019 | $3,849 | $65,360 | $14,880 | $50,480 |
| 2018 | $3,825 | $54,630 | $20,140 | $34,490 |
| 2017 | $3,407 | $54,630 | $20,140 | $34,490 |
| 2016 | $3,066 | $54,630 | $20,140 | $34,490 |
| 2015 | $2,737 | $54,630 | $20,140 | $34,490 |
| 2014 | $2,619 | $51,510 | $20,140 | $31,370 |
| 2013 | $2,621 | $51,510 | $20,140 | $31,370 |
Source: Public Records
Map
Nearby Homes
- 6306 Glenwood Dr
- 6581 Newhouse Ct
- 8379 Mentorwood Dr
- 8295 Mentorwood Dr
- 8443 Trimble Ct Unit A
- 8169 Dalton Ct
- 6148 Worthington Ln Unit A14
- 6283 Hopkins Rd
- 6159 Cambridge Park Dr
- 6122 Cabot Ct Unit C2
- 6676 Oakdale Rd
- 6010 Sea Pines Dr
- 8042 Howell Dr
- 6484 Elmwood Rd
- 6524 Elmwood Rd
- 6539 Mentor Park Blvd
- 6241 Tina Dr
- 8140 Independence Dr Unit B
- 8152 Puritan Dr Unit 44-A
- 8093 Independence Dr Unit D
- 8358 Dallas Dr
- 8378 Dallas Dr
- 8361 Lanmark Dr
- 8351 Lanmark Dr
- 8371 Lanmark Dr
- 8348 Dallas Dr
- 8388 Dallas Dr
- 8365 Dallas Dr
- 8341 Lanmark Dr
- 8375 Dallas Dr
- 8355 Dallas Dr
- 8381 Lanmark Dr
- 8331 Lanmark Dr
- 8345 Dallas Dr
- 8338 Dallas Dr
- 8385 Dallas Dr
- 8398 Dallas Dr
- 8391 Lanmark Dr
- 8321 Lanmark Dr
- 8335 Dallas Dr