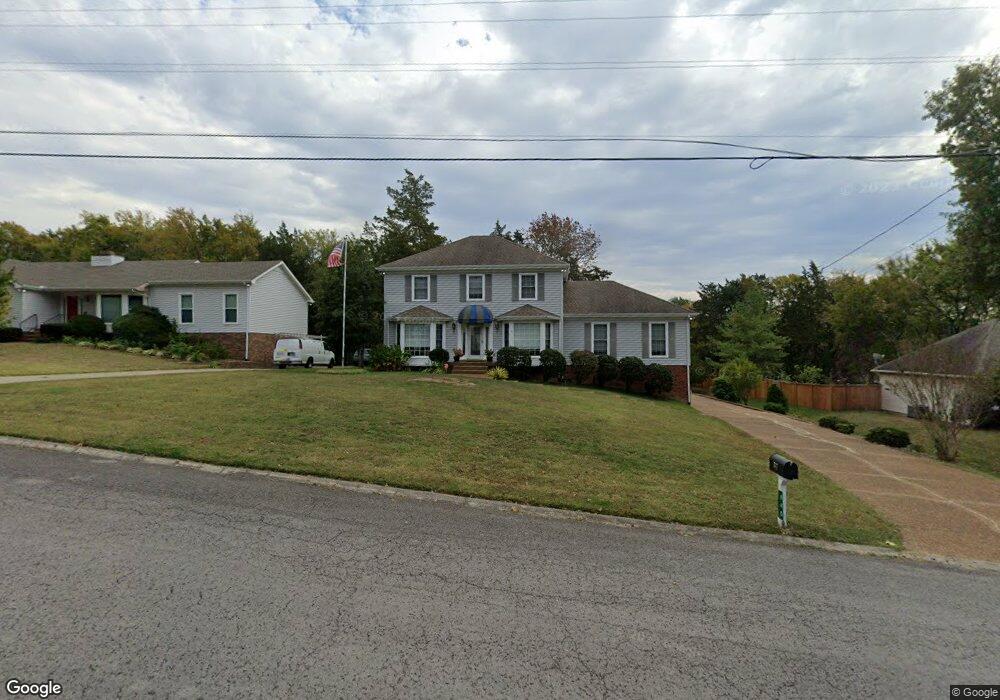
840 Stonebrook Blvd Nolensville, TN 37135
Estimated Value: $609,498 - $710,000
--
Bed
3
Baths
2,471
Sq Ft
$257/Sq Ft
Est. Value
About This Home
This home is located at 840 Stonebrook Blvd, Nolensville, TN 37135 and is currently estimated at $636,125, approximately $257 per square foot. 840 Stonebrook Blvd is a home located in Williamson County with nearby schools including Nolensville Elementary School, Mill Creek Middle School, and Nolensville High School.
Ownership History
Date
Name
Owned For
Owner Type
Purchase Details
Closed on
Sep 26, 2005
Sold by
Felts James L and Felts Juanita L
Bought by
Dacunha Carlos A and Dacunha Susan E
Current Estimated Value
Home Financials for this Owner
Home Financials are based on the most recent Mortgage that was taken out on this home.
Original Mortgage
$196,000
Outstanding Balance
$100,006
Interest Rate
5.12%
Mortgage Type
New Conventional
Estimated Equity
$536,119
Purchase Details
Closed on
Sep 20, 1996
Sold by
Etv Couser Wachala Linda K
Bought by
Felts James L and Felts Juanita L
Purchase Details
Closed on
Sep 18, 1996
Sold by
Etv Couser Wachala Linda K
Bought by
Etv Couser Wachala Linda K
Purchase Details
Closed on
Mar 26, 1996
Sold by
Etv Couser-Wachala Linda K
Bought by
Couser-Wachala Linda K
Purchase Details
Closed on
Mar 22, 1996
Sold by
Etv Couser-Wachala Linda K
Bought by
Etv Couser-Wachala Linda K
Create a Home Valuation Report for This Property
The Home Valuation Report is an in-depth analysis detailing your home's value as well as a comparison with similar homes in the area
Home Values in the Area
Average Home Value in this Area
Purchase History
| Date | Buyer | Sale Price | Title Company |
|---|---|---|---|
| Dacunha Carlos A | $245,000 | Rudy Title & Escrow Llc | |
| Felts James L | $159,900 | -- | |
| Etv Couser Wachala Linda K | -- | -- | |
| Couser-Wachala Linda K | -- | -- | |
| Etv Couser-Wachala Linda K | -- | -- |
Source: Public Records
Mortgage History
| Date | Status | Borrower | Loan Amount |
|---|---|---|---|
| Open | Dacunha Carlos A | $196,000 |
Source: Public Records
Tax History Compared to Growth
Tax History
| Year | Tax Paid | Tax Assessment Tax Assessment Total Assessment is a certain percentage of the fair market value that is determined by local assessors to be the total taxable value of land and additions on the property. | Land | Improvement |
|---|---|---|---|---|
| 2025 | $2,259 | $159,575 | $47,500 | $112,075 |
| 2024 | $2,259 | $104,075 | $21,250 | $82,825 |
| 2023 | $0 | $104,075 | $21,250 | $82,825 |
| 2022 | $2,259 | $104,075 | $21,250 | $82,825 |
| 2021 | $2,259 | $104,075 | $21,250 | $82,825 |
| 2020 | $1,973 | $78,600 | $15,000 | $63,600 |
| 2019 | $1,863 | $78,600 | $15,000 | $63,600 |
| 2018 | $1,808 | $78,600 | $15,000 | $63,600 |
| 2017 | $1,792 | $78,600 | $15,000 | $63,600 |
| 2016 | $0 | $78,600 | $15,000 | $63,600 |
| 2015 | -- | $69,600 | $12,500 | $57,100 |
| 2014 | -- | $69,600 | $12,500 | $57,100 |
Source: Public Records
Map
Nearby Homes
- 1115 Oak Creek Dr
- 0 Nolensville Rd Unit RTC2807764
- 0 Nolensville Rd Unit RTC2818506
- 0 Bostic Unit RTC2516475
- 0 Nolensville Rd Unit RTC3017763
- 607 Quarter Horse Ln
- 829 Stonebrook Blvd
- 1228 Countryside Rd
- 720 Stonecastle Place
- 1016 Dortch Ln
- 813 Stonebrook Blvd
- 2248 Rolling Hills Dr
- 3025 Ash Dale Ln
- 3051 Ash Dale Ln
- 3019 Ash Dale Ln
- 3027 Ash Dale Ln
- 2276 Rolling Hills Dr
- 625 Mer Rouge Dr
- 825 Piccadilly Dr
- 904 Inglenook Ct
- 838 Stonebrook Blvd
- 842 Stonebrook Blvd
- 1413 Bluegrass Rd
- 844 Stonebrook Blvd
- 836 Stonebrook Blvd
- 1415 Bluegrass Rd
- 843 Stonebrook Blvd
- 841 Stonebrook Blvd
- 1417 Bluegrass Rd
- 846 Stonebrook Blvd
- 834 Stonebrook Blvd
- 923 Timberside Dr
- 803 Rockwood Dr
- 1419 Bluegrass Rd
- 848 Stonebrook Blvd
- 845 Stonebrook Blvd
- 832 Stonebrook Blvd
- 921 Timberside Dr
- 1414 Bluegrass Rd
- 805 Rockwood Dr