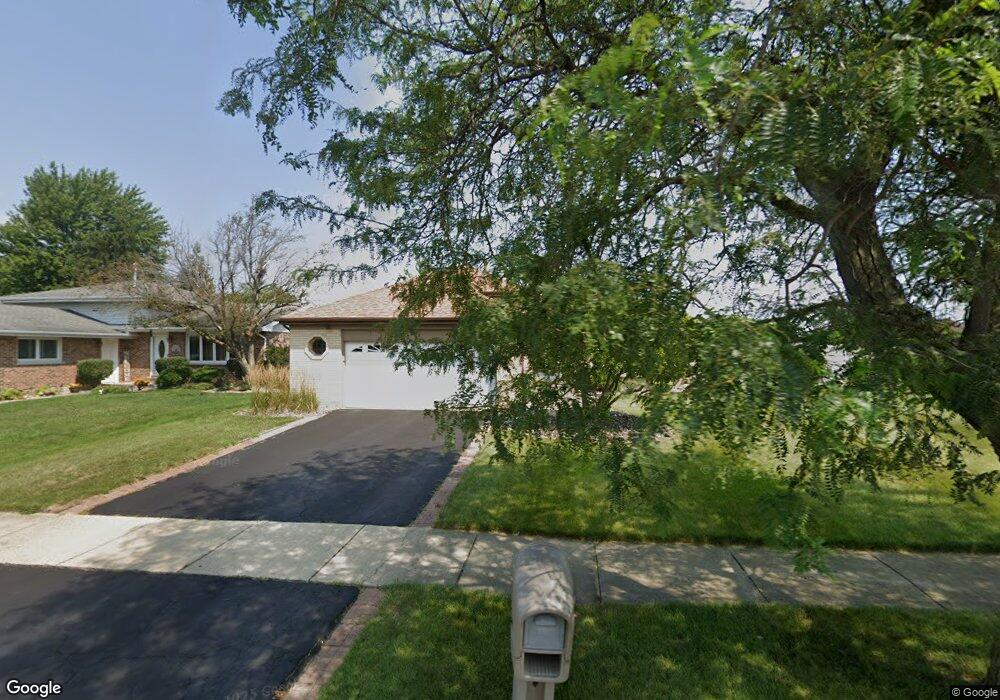
8400 Carriage Ln Tinley Park, IL 60487
Central Tinley Park NeighborhoodEstimated Value: $354,000 - $372,000
3
Beds
2
Baths
1,212
Sq Ft
$301/Sq Ft
Est. Value
About This Home
This home is located at 8400 Carriage Ln, Tinley Park, IL 60487 and is currently estimated at $365,121, approximately $301 per square foot. 8400 Carriage Ln is a home located in Cook County with nearby schools including Christa Mcauliffe School, Prairie View Middle School, and Victor J Andrew High School.
Ownership History
Date
Name
Owned For
Owner Type
Purchase Details
Closed on
Jul 31, 2006
Sold by
Douma Ross and Douma Shawn R
Bought by
Romanow Philip J and Romanow Jaclyn M
Current Estimated Value
Home Financials for this Owner
Home Financials are based on the most recent Mortgage that was taken out on this home.
Original Mortgage
$243,100
Outstanding Balance
$146,666
Interest Rate
6.85%
Mortgage Type
Purchase Money Mortgage
Estimated Equity
$218,455
Purchase Details
Closed on
Jul 27, 2001
Sold by
Wittle Robert P and Wittle Diana J
Bought by
Douma Ross and Douma Shawn
Home Financials for this Owner
Home Financials are based on the most recent Mortgage that was taken out on this home.
Original Mortgage
$155,000
Interest Rate
7.14%
Purchase Details
Closed on
May 31, 1996
Sold by
Emley Victor R and Emley Ruth R
Bought by
Wittle Robert P and Wittle Diana J
Home Financials for this Owner
Home Financials are based on the most recent Mortgage that was taken out on this home.
Original Mortgage
$154,850
Interest Rate
7.99%
Create a Home Valuation Report for This Property
The Home Valuation Report is an in-depth analysis detailing your home's value as well as a comparison with similar homes in the area
Home Values in the Area
Average Home Value in this Area
Purchase History
| Date | Buyer | Sale Price | Title Company |
|---|---|---|---|
| Romanow Philip J | $286,000 | Cti | |
| Douma Ross | $183,000 | -- | |
| Wittle Robert P | $163,000 | -- |
Source: Public Records
Mortgage History
| Date | Status | Borrower | Loan Amount |
|---|---|---|---|
| Open | Romanow Philip J | $243,100 | |
| Previous Owner | Douma Ross | $155,000 | |
| Previous Owner | Wittle Robert P | $154,850 |
Source: Public Records
Tax History Compared to Growth
Tax History
| Year | Tax Paid | Tax Assessment Tax Assessment Total Assessment is a certain percentage of the fair market value that is determined by local assessors to be the total taxable value of land and additions on the property. | Land | Improvement |
|---|---|---|---|---|
| 2024 | $7,302 | $29,614 | $5,980 | $23,634 |
| 2023 | $5,891 | $33,000 | $5,980 | $27,020 |
| 2022 | $5,891 | $19,945 | $5,200 | $14,745 |
| 2021 | $5,733 | $19,945 | $5,200 | $14,745 |
| 2020 | $5,660 | $19,945 | $5,200 | $14,745 |
| 2019 | $6,230 | $22,639 | $4,680 | $17,959 |
| 2018 | $6,095 | $22,639 | $4,680 | $17,959 |
| 2017 | $5,951 | $22,639 | $4,680 | $17,959 |
| 2016 | $5,751 | $19,812 | $4,160 | $15,652 |
| 2015 | $5,648 | $19,812 | $4,160 | $15,652 |
| 2014 | $5,617 | $19,812 | $4,160 | $15,652 |
| 2013 | $5,475 | $20,758 | $4,160 | $16,598 |
Source: Public Records
Map
Nearby Homes
- 17155 Kamp Ct Unit 9
- 8444 W 171st St
- 8456 170th Place
- 8548 Bethany Ln
- 8543 Carriage Ln
- 8229 170th St Unit 8229
- 16933 Richards Dr
- 17324 Humber Ln
- 17003 Grissom Dr Unit 2N
- 8313 Aster Ln
- 8030 Valley View Dr
- 8721 W 169th St
- 8710 W 168th St
- 8750 W 169th St
- Fremont Plan at Radcliffe Place
- Calysta Plan at Radcliffe Place
- Danbury Plan at Radcliffe Place
- Briarcliffe Plan at Radcliffe Place
- Eden Plan at Radcliffe Place
- Amberwood Plan at Radcliffe Place
- 8406 Carriage Ln
- 8412 Carriage Ln
- 8401 Carriage Ln
- 8407 Carriage Ln
- 8418 Carriage Ln
- 8413 Carriage Ln
- 17131 Kamp Ct Unit 15
- 8424 Carriage Ln
- 17207 Cottage Ct
- 17127 Kamp Ct Unit 16
- 17135 Kamp Ct Unit 14
- 17123 Kamp Ct Unit 17
- 8430 Carriage Ln
- 17139 Kamp Ct Unit 13
- 17119 Kamp Ct Unit 18
- 17143 Kamp Ct Unit 12
- 8425 Carriage Ln
- 17213 Cottage Ct
- 17147 Kamp Ct Unit 11
- 8436 Carriage Ln