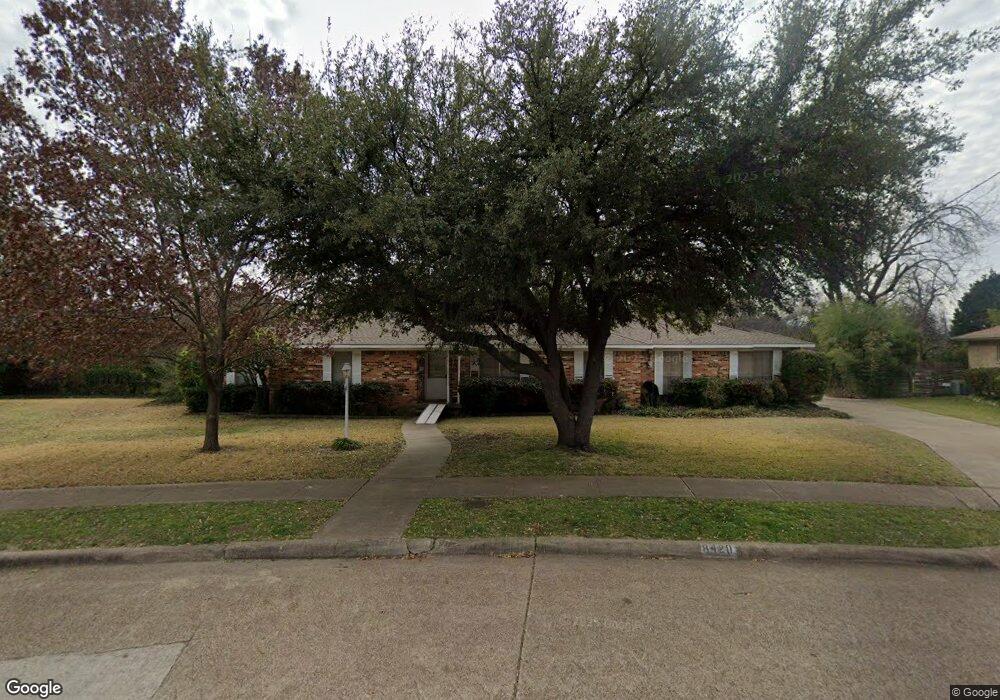
8420 Bellingham Dr Dallas, TX 75228
White Rock Hills NeighborhoodEstimated Value: $464,000 - $563,375
3
Beds
3
Baths
2,657
Sq Ft
$199/Sq Ft
Est. Value
About This Home
This home is located at 8420 Bellingham Dr, Dallas, TX 75228 and is currently estimated at $528,094, approximately $198 per square foot. 8420 Bellingham Dr is a home located in Dallas County with nearby schools including Bayles Elementary School, W High Gaston Middle School, and Bryan Adams High School.
Ownership History
Date
Name
Owned For
Owner Type
Purchase Details
Closed on
Aug 27, 2025
Sold by
June H Paulson Revocable Trust and Paulson Carlton Roger
Bought by
Mcneil Eugene and Mcneil Caitlin
Current Estimated Value
Home Financials for this Owner
Home Financials are based on the most recent Mortgage that was taken out on this home.
Original Mortgage
$432,100
Outstanding Balance
$432,100
Interest Rate
6.74%
Mortgage Type
New Conventional
Estimated Equity
$95,994
Purchase Details
Closed on
Aug 26, 2025
Sold by
Mcneil Eugene and Mcneil Caitlin
Bought by
Revive Dfw Llc
Home Financials for this Owner
Home Financials are based on the most recent Mortgage that was taken out on this home.
Original Mortgage
$432,100
Outstanding Balance
$432,100
Interest Rate
6.74%
Mortgage Type
New Conventional
Estimated Equity
$95,994
Purchase Details
Closed on
Jul 23, 2013
Sold by
Paulson June H
Bought by
Paulson June H and The June H Paulson Revocable Trust
Create a Home Valuation Report for This Property
The Home Valuation Report is an in-depth analysis detailing your home's value as well as a comparison with similar homes in the area
Home Values in the Area
Average Home Value in this Area
Purchase History
| Date | Buyer | Sale Price | Title Company |
|---|---|---|---|
| Mcneil Eugene | -- | Capital Title | |
| Revive Dfw Llc | -- | None Listed On Document | |
| Sww Properties Llc | -- | None Listed On Document | |
| Paulson June H | -- | None Available |
Source: Public Records
Mortgage History
| Date | Status | Borrower | Loan Amount |
|---|---|---|---|
| Open | Sww Properties Llc | $432,100 |
Source: Public Records
Tax History Compared to Growth
Tax History
| Year | Tax Paid | Tax Assessment Tax Assessment Total Assessment is a certain percentage of the fair market value that is determined by local assessors to be the total taxable value of land and additions on the property. | Land | Improvement |
|---|---|---|---|---|
| 2025 | $11,646 | $543,200 | $120,000 | $423,200 |
| 2024 | $11,646 | $543,200 | $120,000 | $423,200 |
| 2023 | $9,965 | $434,230 | $120,000 | $314,230 |
| 2022 | $10,857 | $434,230 | $120,000 | $314,230 |
| 2021 | $8,870 | $336,250 | $91,800 | $244,450 |
| 2020 | $9,122 | $336,250 | $91,800 | $244,450 |
| 2019 | $9,567 | $336,250 | $91,800 | $244,450 |
| 2018 | $6,641 | $244,230 | $69,600 | $174,630 |
| 2017 | $5,767 | $212,080 | $60,000 | $152,080 |
| 2016 | $4,321 | $158,890 | $42,000 | $116,890 |
| 2015 | $978 | $152,560 | $30,000 | $122,560 |
| 2014 | $978 | $149,520 | $30,000 | $119,520 |
Source: Public Records
Map
Nearby Homes
- 8318 Londonderry Ln
- 3144 Dorrington Dr
- 6124 N Jim Miller Rd
- 8309 Londonderry Ln
- 3330 Sharpview Ln
- 6225 N Jim Miller Rd
- 8508 Londonderry Ln
- 8511 Londonderry Ln
- 8516 Bellingham Dr
- 8507 Baumgarten Dr
- 8327 Coolgreene Dr
- 8515 Baumgarten Dr
- 8324 Coolgreene Dr
- 6331 N Jim Miller Rd
- 8528 Van Pelt Dr
- 8312 Bocowood Dr
- 8405 Bocowood Dr
- 5837 Clendenin Ave
- 8617 Baumgarten Dr
- 8216 Coolgreene Dr
- 8414 Bellingham Dr
- 8429 Bellingham Dr
- 3114 Dorrington Cir
- 3106 Dorrington Cir
- 8354 Londonderry Ln
- 8434 Bellingham Dr
- 8348 Londonderry Ln
- 3038 Dorrington Dr
- 8342 Londonderry Ln
- 8435 Bellingham Dr
- 8408 Londonderry Ln
- 8438 Bellingham Dr
- 8338 Londonderry Ln
- 3118 Dorrington Cir
- 8412 Londonderry Ln
- 8441 Bellingham Dr
- 3034 Dorrington Dr
- 8334 Londonderry Ln
- 8444 Bellingham Dr
- 3122 Dorrington Cir