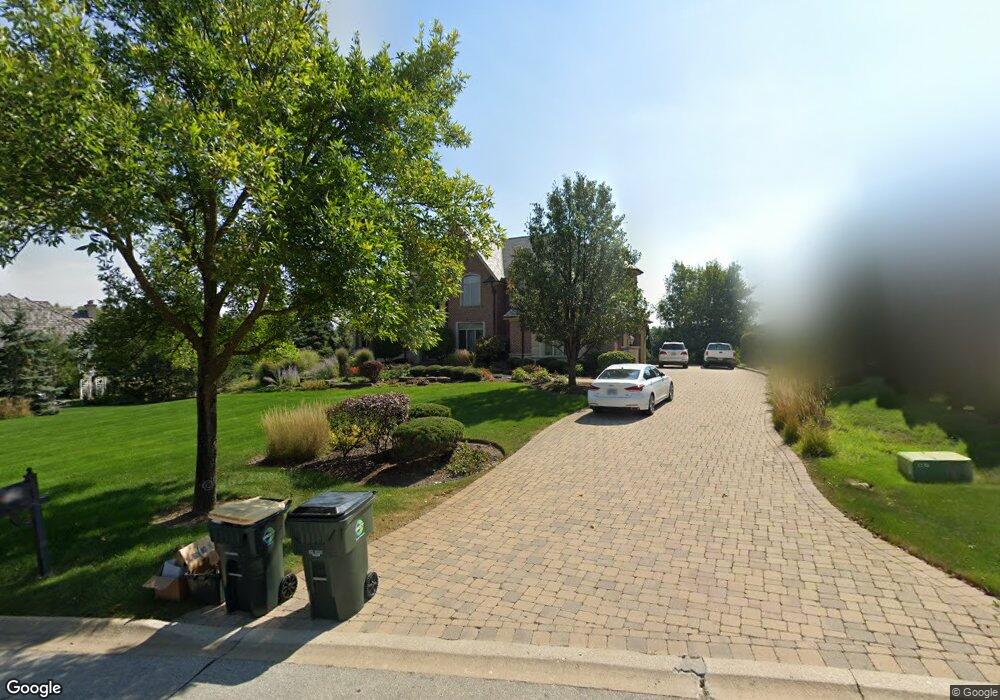
8429 Arrowhead Farm Dr Burr Ridge, IL 60527
Burr Ridge East NeighborhoodEstimated Value: $1,476,000 - $2,468,000
4
Beds
3
Baths
5,057
Sq Ft
$369/Sq Ft
Est. Value
About This Home
This home is located at 8429 Arrowhead Farm Dr, Burr Ridge, IL 60527 and is currently estimated at $1,866,703, approximately $369 per square foot. 8429 Arrowhead Farm Dr is a home located in Cook County with nearby schools including Pleasantdale Elementary School, Pleasantdale Middle School, and Lyons Township High School.
Ownership History
Date
Name
Owned For
Owner Type
Purchase Details
Closed on
Feb 27, 2025
Sold by
Hojjat Fariborz M and Hojjat Margaret A
Bought by
Hojjat Real Property Trust and Hojjat
Current Estimated Value
Purchase Details
Closed on
Mar 24, 2011
Sold by
Hojjat Margaret A
Bought by
Hojjat Fariborz M and Hojjat Margaret Ann
Home Financials for this Owner
Home Financials are based on the most recent Mortgage that was taken out on this home.
Original Mortgage
$417,000
Interest Rate
5.04%
Mortgage Type
New Conventional
Purchase Details
Closed on
Jun 24, 2004
Sold by
Hojjat Fariborz M and Hojjat Margaret A
Bought by
Hojjat Margaret A and Margaret Hojjat Trust
Purchase Details
Closed on
Oct 25, 2001
Sold by
Boini Balakrishna and Boini Suguna
Bought by
Standard Bank & Trust Company and Trust #17121
Purchase Details
Closed on
Aug 24, 1993
Sold by
State Bank Of Countryside
Bought by
Boini Balakrishna and Boini Suguna
Create a Home Valuation Report for This Property
The Home Valuation Report is an in-depth analysis detailing your home's value as well as a comparison with similar homes in the area
Home Values in the Area
Average Home Value in this Area
Purchase History
| Date | Buyer | Sale Price | Title Company |
|---|---|---|---|
| Hojjat Real Property Trust | -- | None Listed On Document | |
| Hojjat Fariborz M | -- | Fidelity National Title | |
| Hojjat Margaret A | -- | -- | |
| Standard Bank & Trust Company | $384,000 | -- | |
| Boini Balakrishna | -- | -- |
Source: Public Records
Mortgage History
| Date | Status | Borrower | Loan Amount |
|---|---|---|---|
| Previous Owner | Hojjat Fariborz M | $417,000 |
Source: Public Records
Tax History Compared to Growth
Tax History
| Year | Tax Paid | Tax Assessment Tax Assessment Total Assessment is a certain percentage of the fair market value that is determined by local assessors to be the total taxable value of land and additions on the property. | Land | Improvement |
|---|---|---|---|---|
| 2024 | $24,283 | $120,813 | $34,692 | $86,121 |
| 2023 | $20,927 | $131,000 | $34,692 | $96,308 |
| 2022 | $20,927 | $98,859 | $30,487 | $68,372 |
| 2021 | $21,126 | $103,055 | $30,486 | $72,569 |
| 2020 | $22,132 | $110,993 | $30,486 | $80,507 |
| 2019 | $22,135 | $112,291 | $27,333 | $84,958 |
| 2018 | $25,297 | $125,338 | $27,333 | $98,005 |
| 2017 | $27,295 | $139,922 | $27,333 | $112,589 |
| 2016 | $21,094 | $98,825 | $24,179 | $74,646 |
| 2015 | $22,245 | $104,332 | $24,179 | $80,153 |
| 2014 | $21,905 | $108,024 | $24,179 | $83,845 |
| 2013 | $20,574 | $104,282 | $24,179 | $80,103 |
Source: Public Records
Map
Nearby Homes
- 8425 S Hickory Ct
- 17 Buege Ln
- 1 Hidden Lake Dr
- 8302 Pleasant View Ave
- 8120 Woodside Ln
- 11702 German Church Rd
- 8101 S County Line Rd
- 11307 German Church Rd
- 11901 Heritage Dr
- 8010 Greenbriar Ct
- 11665 Orchard Rd
- 8886 Johnston Rd
- 11735 Orchard Rd
- 8850 S County Line Rd
- 9032 Wolf Rd
- 8080 Wolf Rd
- 179 Foxborough Place Unit 179
- 8408 Willow Dr W
- 17 Ambriance Dr
- 10940 German Church Rd
- 8447 Arrowhead Farm Dr
- 8417 Arrowhead Farm Dr
- 8450 Omaha Dr
- 8532 Johnston Rd
- 8542 Johnston Rd
- 8465 Arrowhead Farm Dr
- 8456 Arrowhead Farm Dr
- 8522 Johnston Rd
- 8552 Johnston Rd
- 8486 Omaha Dr
- 8428 Arrowhead Farm Dr
- 8410 Arrowhead Farm Dr
- 8512 Johnston Rd
- 8562 Johnston Rd
- 8481 Arrowhead Farm Dr
- 8425 Omaha Dr
- 8449 Omaha Dr
- 8497 Arrowhead Farm Dr
- 8472 Arrowhead Farm Dr
- 8368 Arrowhead Farm Dr