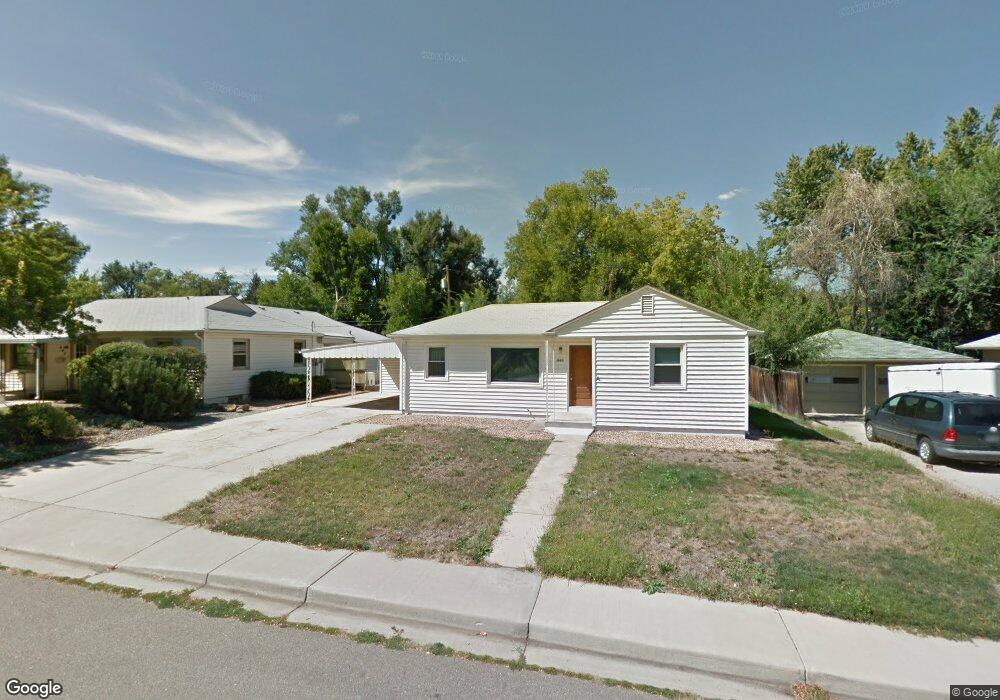
843 Judson St Longmont, CO 80501
Sunset NeighborhoodEstimated Value: $447,397 - $480,000
2
Beds
1
Bath
768
Sq Ft
$600/Sq Ft
Est. Value
About This Home
This home is located at 843 Judson St, Longmont, CO 80501 and is currently estimated at $460,599, approximately $599 per square foot. 843 Judson St is a home located in Boulder County with nearby schools including Central Elementary School, Westview Middle School, and Longmont High School.
Ownership History
Date
Name
Owned For
Owner Type
Purchase Details
Closed on
Jun 28, 2017
Sold by
Nurv Ltd
Bought by
Mccluskey John
Current Estimated Value
Home Financials for this Owner
Home Financials are based on the most recent Mortgage that was taken out on this home.
Original Mortgage
$218,000
Outstanding Balance
$181,765
Interest Rate
4.02%
Mortgage Type
Purchase Money Mortgage
Estimated Equity
$278,834
Purchase Details
Closed on
Oct 18, 2004
Sold by
Dorr Kim L and Estate Of Ferne L Dieleman
Bought by
Harmon Scott
Home Financials for this Owner
Home Financials are based on the most recent Mortgage that was taken out on this home.
Original Mortgage
$152,503
Interest Rate
5.82%
Mortgage Type
FHA
Purchase Details
Closed on
Dec 6, 1950
Bought by
Harmon Scott
Create a Home Valuation Report for This Property
The Home Valuation Report is an in-depth analysis detailing your home's value as well as a comparison with similar homes in the area
Home Values in the Area
Average Home Value in this Area
Purchase History
| Date | Buyer | Sale Price | Title Company |
|---|---|---|---|
| Mccluskey John | $222,000 | None Available | |
| Nurv Ltd | $195,000 | None Available | |
| Harmon Scott | $154,900 | Fahtco | |
| Harmon Scott | -- | -- |
Source: Public Records
Mortgage History
| Date | Status | Borrower | Loan Amount |
|---|---|---|---|
| Open | Nurv Ltd | $218,000 | |
| Open | Mccluskey John | $424,000 | |
| Previous Owner | Harmon Scott | $152,503 |
Source: Public Records
Tax History Compared to Growth
Tax History
| Year | Tax Paid | Tax Assessment Tax Assessment Total Assessment is a certain percentage of the fair market value that is determined by local assessors to be the total taxable value of land and additions on the property. | Land | Improvement |
|---|---|---|---|---|
| 2025 | $2,988 | $32,600 | $9,256 | $23,344 |
| 2024 | $2,988 | $32,600 | $9,256 | $23,344 |
| 2023 | $4,315 | $31,235 | $10,358 | $24,562 |
| 2022 | $4,007 | $27,355 | $7,624 | $19,731 |
| 2021 | $3,978 | $28,143 | $7,844 | $20,299 |
| 2020 | $3,739 | $26,391 | $7,079 | $19,312 |
| 2019 | $3,640 | $26,391 | $7,079 | $19,312 |
| 2018 | $2,678 | $17,014 | $8,136 | $8,878 |
| 2017 | $3,033 | $18,810 | $8,995 | $9,815 |
| 2016 | $2,863 | $14,893 | $8,915 | $5,978 |
| 2015 | $2,796 | $12,473 | $4,378 | $8,095 |
| 2014 | $2,604 | $12,473 | $4,378 | $8,095 |
Source: Public Records
Map
Nearby Homes