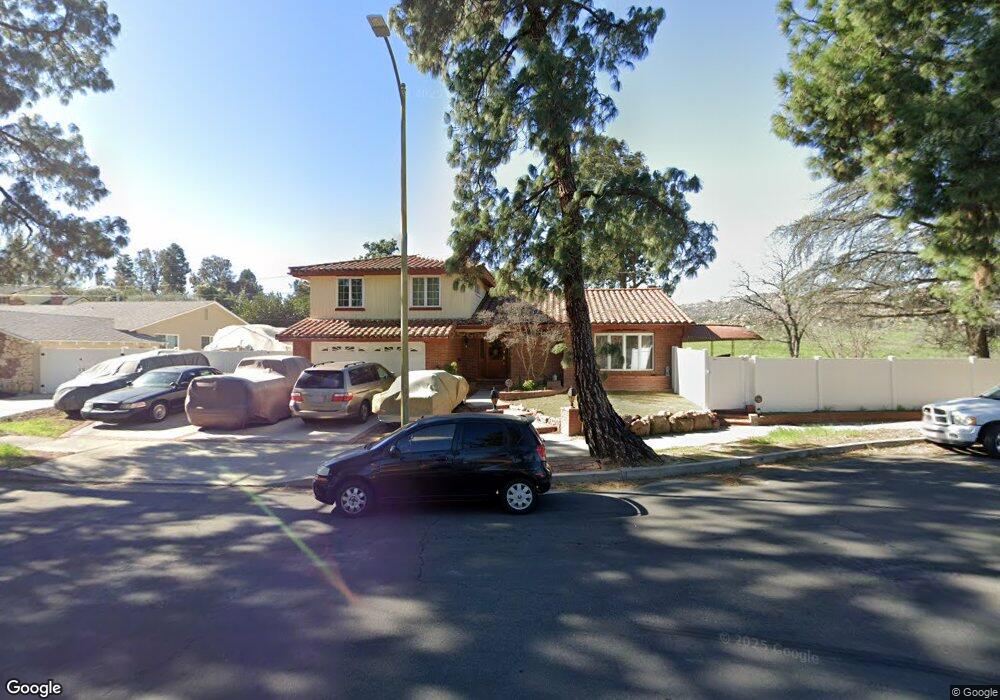
8435 Jason Ave Canoga Park, CA 91304
Canoga Park NeighborhoodEstimated Value: $1,020,532 - $1,161,000
4
Beds
2
Baths
2,090
Sq Ft
$531/Sq Ft
Est. Value
About This Home
This home is located at 8435 Jason Ave, Canoga Park, CA 91304 and is currently estimated at $1,108,883, approximately $530 per square foot. 8435 Jason Ave is a home located in Los Angeles County with nearby schools including Christopher Columbus Middle School, Justice Street Academy Charter, and Pomelo Community Charter.
Ownership History
Date
Name
Owned For
Owner Type
Purchase Details
Closed on
Apr 2, 2001
Sold by
Haney Jo Ann
Bought by
Chartrand Rodger H and Chartrand Faith A
Current Estimated Value
Home Financials for this Owner
Home Financials are based on the most recent Mortgage that was taken out on this home.
Original Mortgage
$284,000
Interest Rate
7.37%
Mortgage Type
Purchase Money Mortgage
Purchase Details
Closed on
Aug 19, 1994
Sold by
Schisano Mary
Bought by
Haney Robert E and Haney Jo Ann
Home Financials for this Owner
Home Financials are based on the most recent Mortgage that was taken out on this home.
Original Mortgage
$135,000
Interest Rate
6.25%
Mortgage Type
Purchase Money Mortgage
Purchase Details
Closed on
Mar 17, 1994
Sold by
Schisano Deceased Thomas Gaetano
Bought by
Schisano Mary
Create a Home Valuation Report for This Property
The Home Valuation Report is an in-depth analysis detailing your home's value as well as a comparison with similar homes in the area
Home Values in the Area
Average Home Value in this Area
Purchase History
| Date | Buyer | Sale Price | Title Company |
|---|---|---|---|
| Chartrand Rodger H | $355,000 | First American Title Co | |
| Haney Jo Ann | -- | First American | |
| Haney Robert E | $247,000 | Stewart Title | |
| Schisano Mary | -- | -- |
Source: Public Records
Mortgage History
| Date | Status | Borrower | Loan Amount |
|---|---|---|---|
| Previous Owner | Chartrand Rodger H | $284,000 | |
| Previous Owner | Haney Robert E | $135,000 | |
| Closed | Chartrand Rodger H | $71,000 |
Source: Public Records
Tax History Compared to Growth
Tax History
| Year | Tax Paid | Tax Assessment Tax Assessment Total Assessment is a certain percentage of the fair market value that is determined by local assessors to be the total taxable value of land and additions on the property. | Land | Improvement |
|---|---|---|---|---|
| 2025 | $6,722 | $534,905 | $343,098 | $191,807 |
| 2024 | $6,722 | $524,418 | $336,371 | $188,047 |
| 2023 | $6,597 | $514,136 | $329,776 | $184,360 |
| 2022 | $6,301 | $504,056 | $323,310 | $180,746 |
| 2021 | $6,218 | $494,173 | $316,971 | $177,202 |
| 2019 | $6,037 | $479,518 | $307,570 | $171,948 |
| 2018 | $5,901 | $470,117 | $301,540 | $168,577 |
| 2016 | $5,629 | $451,864 | $289,832 | $162,032 |
| 2015 | $5,549 | $445,078 | $285,479 | $159,599 |
| 2014 | $5,574 | $436,360 | $279,887 | $156,473 |
Source: Public Records
Map
Nearby Homes
- 8404 Joan Ln
- 23546 Community St
- 8324 Joan Ln
- 8373 Denise Ln
- 23200 Justice St
- 23676 Justice St
- 23774 Burton St
- 23911 Homezell Dr
- 8108 Royer Ave
- 23950 Los Rosas St
- 8304 Mariposa Ct
- 23961 Eagle Mountain St
- 22824 W Olive Way
- 23942 Schoenborn St
- 8300 Mariposa Ct
- 8565 N Walnut Way
- 8657 Valley Flores Dr
- 8744 Azul Dr
- 22906 Lanark St
- 7925 Royer Ave
- 8425 Jason Ave
- 8464 Pinelake Dr
- 8436 Jason Ave
- 8430 Jason Ave
- 8421 Jason Ave
- 8444 Jason Ave
- 8424 Jason Ave
- 8463 Pinelake Dr
- 8460 Pinelake Dr
- 8419 Jason Ave
- 8445 Melba Ave
- 8451 Melba Ave
- 8431 Melba Ave
- 8455 Melba Ave
- 8415 Jason Ave
- 8416 Jason Ave
- 8452 Pinelake Dr
- 8463 Melba Ave
- 8455 Pinelake Dr
- 8444 Melba Ave