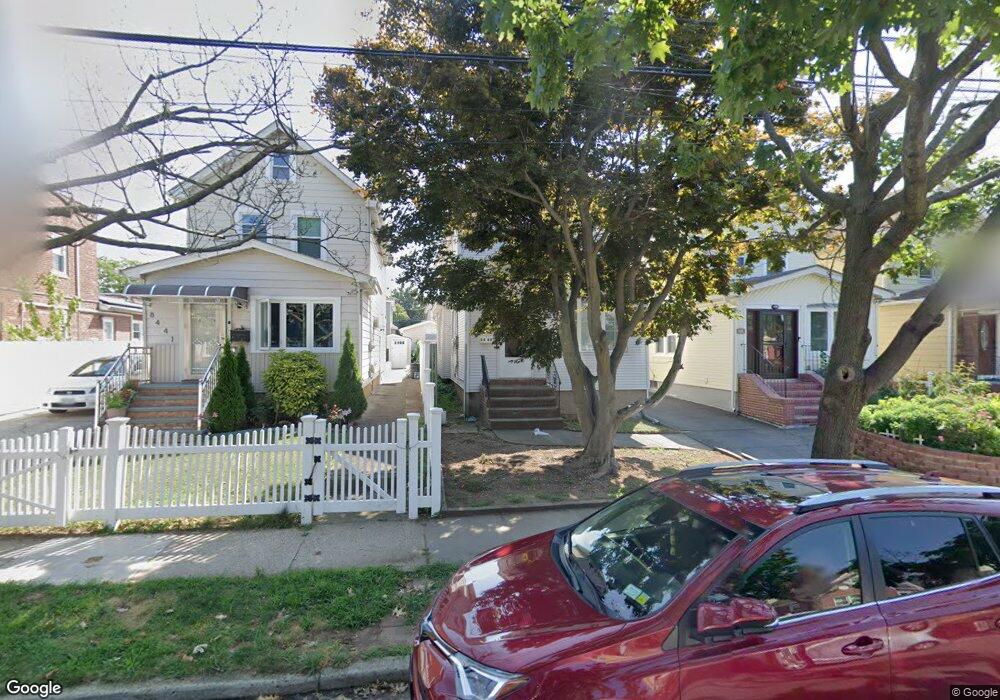
8443 259th St Floral Park, NY 11001
Estimated Value: $790,000 - $828,000
--
Bed
--
Bath
1,216
Sq Ft
$664/Sq Ft
Est. Value
About This Home
This home is located at 8443 259th St, Floral Park, NY 11001 and is currently estimated at $807,199, approximately $663 per square foot. 8443 259th St is a home located in Queens County with nearby schools including P.S. 191 Mayflower School, Fremont/Hay Elementary School, and Irwin Altman Middle School 172.
Ownership History
Date
Name
Owned For
Owner Type
Purchase Details
Closed on
Jun 1, 2010
Sold by
Nibungco Deni L and Nibungco Yessenia
Bought by
Yoo Hyun Sook
Current Estimated Value
Home Financials for this Owner
Home Financials are based on the most recent Mortgage that was taken out on this home.
Original Mortgage
$223,500
Outstanding Balance
$149,668
Interest Rate
5.11%
Mortgage Type
Purchase Money Mortgage
Estimated Equity
$657,531
Purchase Details
Closed on
Apr 13, 2004
Sold by
Tanner Hugh and Tanner Sabina
Bought by
Nibungco Deni L and Nibungco Yessenia
Home Financials for this Owner
Home Financials are based on the most recent Mortgage that was taken out on this home.
Original Mortgage
$70,050
Interest Rate
5.36%
Create a Home Valuation Report for This Property
The Home Valuation Report is an in-depth analysis detailing your home's value as well as a comparison with similar homes in the area
Home Values in the Area
Average Home Value in this Area
Purchase History
| Date | Buyer | Sale Price | Title Company |
|---|---|---|---|
| Yoo Hyun Sook | $447,000 | -- | |
| Yoo Hyun Sook | $447,000 | -- | |
| Nibungco Deni L | $425,000 | -- | |
| Nibungco Deni L | $425,000 | -- |
Source: Public Records
Mortgage History
| Date | Status | Borrower | Loan Amount |
|---|---|---|---|
| Open | Yoo Hyun Sook | $223,500 | |
| Closed | Yoo Hyun Sook | $223,500 | |
| Previous Owner | Nibungco Deni L | $70,050 | |
| Previous Owner | Nibungco Deni L | $333,700 |
Source: Public Records
Tax History Compared to Growth
Tax History
| Year | Tax Paid | Tax Assessment Tax Assessment Total Assessment is a certain percentage of the fair market value that is determined by local assessors to be the total taxable value of land and additions on the property. | Land | Improvement |
|---|---|---|---|---|
| 2025 | $5,440 | $28,663 | $8,428 | $20,235 |
| 2024 | $5,440 | $27,086 | $9,425 | $17,661 |
| 2023 | $5,181 | $25,795 | $8,598 | $17,197 |
| 2022 | $4,892 | $40,080 | $13,320 | $26,760 |
| 2021 | $5,157 | $42,900 | $13,320 | $29,580 |
| 2020 | $5,056 | $36,900 | $13,320 | $23,580 |
| 2019 | $4,722 | $39,660 | $13,320 | $26,340 |
| 2018 | $4,382 | $21,496 | $9,544 | $11,952 |
| 2017 | $4,163 | $20,420 | $9,366 | $11,054 |
| 2016 | $4,082 | $20,420 | $9,366 | $11,054 |
| 2015 | $2,323 | $19,905 | $9,294 | $10,611 |
| 2014 | $2,323 | $18,810 | $10,535 | $8,275 |
Source: Public Records
Map
Nearby Homes
- 261-16 E Williston Ave
- 8343 261st St
- 8418 263rd St
- 86-16 262nd St
- 8303 261st St
- 258-15 83rd Ave
- 85-23 264th St
- 258-09 87th Ave
- 8604 Little Neck Pkwy
- 83-29 Little Neck Pkwy
- 96 Holland Ave
- 82-44 263rd St
- 87-15 258th St
- 85-40 253rd St
- 8211 260th St
- 84-05 266th St
- 84-03 266th St
- 293 85th Ave
- 119 Emerson Ave
- 224 Bryant Ave