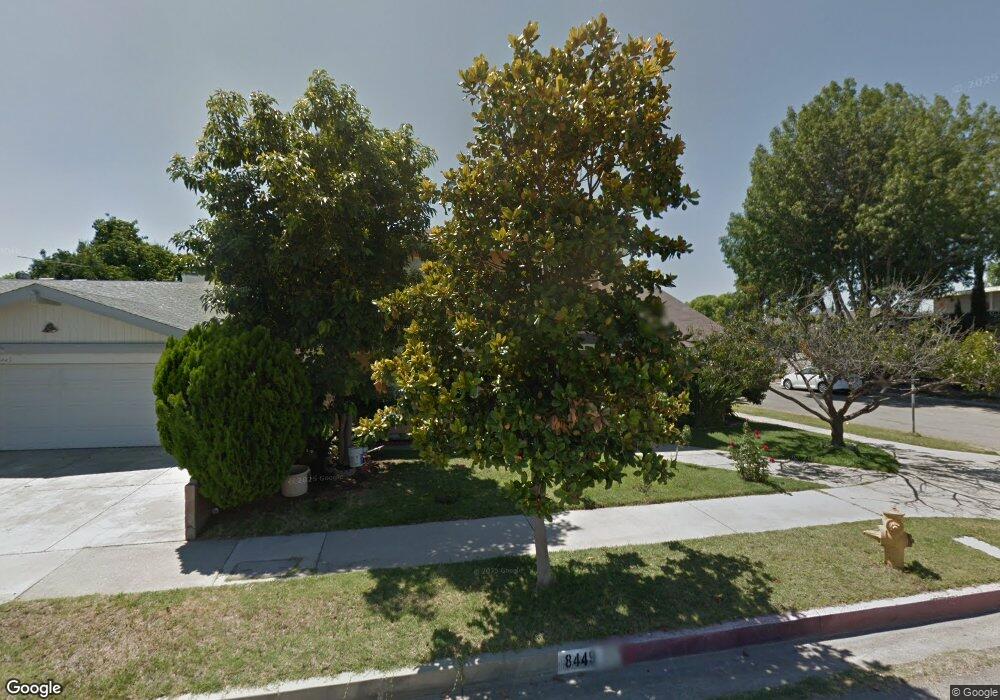
8449 Independence Ave Canoga Park, CA 91304
Canoga Park NeighborhoodEstimated Value: $903,222 - $1,088,000
3
Beds
3
Baths
2,272
Sq Ft
$426/Sq Ft
Est. Value
About This Home
This home is located at 8449 Independence Ave, Canoga Park, CA 91304 and is currently estimated at $967,806, approximately $425 per square foot. 8449 Independence Ave is a home located in Los Angeles County with nearby schools including Limerick Avenue Elementary School, Christopher Columbus Middle School, and Ernest Lawrence Middle School.
Ownership History
Date
Name
Owned For
Owner Type
Purchase Details
Closed on
Nov 13, 2018
Sold by
Mai Hung Q
Bought by
Mai Hung Q and Han Phung Thi Ngoc
Current Estimated Value
Purchase Details
Closed on
Nov 7, 2000
Sold by
Alviar Virginia F
Bought by
Mai Hung Q
Home Financials for this Owner
Home Financials are based on the most recent Mortgage that was taken out on this home.
Original Mortgage
$180,000
Outstanding Balance
$66,042
Interest Rate
7.82%
Estimated Equity
$901,764
Purchase Details
Closed on
Aug 17, 1994
Sold by
Federal Home Loan Mortgage Corporation
Bought by
Alviar Virginia F
Home Financials for this Owner
Home Financials are based on the most recent Mortgage that was taken out on this home.
Original Mortgage
$124,800
Interest Rate
8.7%
Purchase Details
Closed on
Jul 6, 1994
Sold by
Ress Financial Corp
Bought by
Federal Home Loan Mortgage Corporation
Home Financials for this Owner
Home Financials are based on the most recent Mortgage that was taken out on this home.
Original Mortgage
$124,800
Interest Rate
8.7%
Create a Home Valuation Report for This Property
The Home Valuation Report is an in-depth analysis detailing your home's value as well as a comparison with similar homes in the area
Home Values in the Area
Average Home Value in this Area
Purchase History
| Date | Buyer | Sale Price | Title Company |
|---|---|---|---|
| Mai Hung Q | -- | Western Resource Title Compa | |
| Mai Hung Q | $225,000 | Progressive Title Company | |
| Alviar Virginia F | $156,000 | Fidelity National Title Ins | |
| Federal Home Loan Mortgage Corporation | $145,778 | -- |
Source: Public Records
Mortgage History
| Date | Status | Borrower | Loan Amount |
|---|---|---|---|
| Open | Mai Hung Q | $180,000 | |
| Previous Owner | Alviar Virginia F | $124,800 |
Source: Public Records
Tax History Compared to Growth
Tax History
| Year | Tax Paid | Tax Assessment Tax Assessment Total Assessment is a certain percentage of the fair market value that is determined by local assessors to be the total taxable value of land and additions on the property. | Land | Improvement |
|---|---|---|---|---|
| 2025 | $4,379 | $339,019 | $182,317 | $156,702 |
| 2024 | $4,379 | $332,373 | $178,743 | $153,630 |
| 2023 | $4,300 | $325,857 | $175,239 | $150,618 |
| 2022 | $4,108 | $319,468 | $171,803 | $147,665 |
| 2021 | $4,048 | $313,205 | $168,435 | $144,770 |
| 2019 | $3,932 | $303,917 | $163,440 | $140,477 |
| 2018 | $3,837 | $297,959 | $160,236 | $137,723 |
| 2016 | $3,649 | $286,391 | $154,015 | $132,376 |
| 2015 | $3,598 | $282,090 | $151,702 | $130,388 |
| 2014 | $3,616 | $276,565 | $148,731 | $127,834 |
Source: Public Records
Map
Nearby Homes
- 20921 Community St Unit 12
- 21050 Community St
- 20920 Community St Unit 7
- 20851 Community St Unit 10
- 8341 De Soto Ave Unit 10
- 20951 Roscoe Blvd
- 8575 Independence Ave Unit 11
- 8565 Independence Ave Unit 7
- 8540 De Soto Ave Unit 49
- 8558 De Soto Ave Unit 41
- 21305 Chase St
- 21126 Bryant St
- 21315 Community St
- 21219 Roscoe Blvd Unit 211
- 8328 N Cooper Place
- 21000 Parthenia St Unit 19
- 20838 Bryant St
- 21040 Parthenia St Unit 20
- 20930 Parthenia St Unit 216
- 20954 Parthenia St Unit 20
- 8443 Independence Ave
- 21012 Rodax St
- 8437 Independence Ave
- 8461 Independence Ave
- 21018 Rodax St
- 21011 Hackney St
- 8431 Independence Ave
- 8465 Independence Ave
- 8450 Independence Ave
- 21015 Rodax St
- 8444 Independence Ave
- 21022 Rodax St
- 21019 Hackney St
- 8436 Independence Ave
- 8460 Independence Ave
- 21019 Rodax St
- 8471 Independence Ave
- 21023 Hackney St
- 8430 Independence Ave
- 8464 Independence Ave