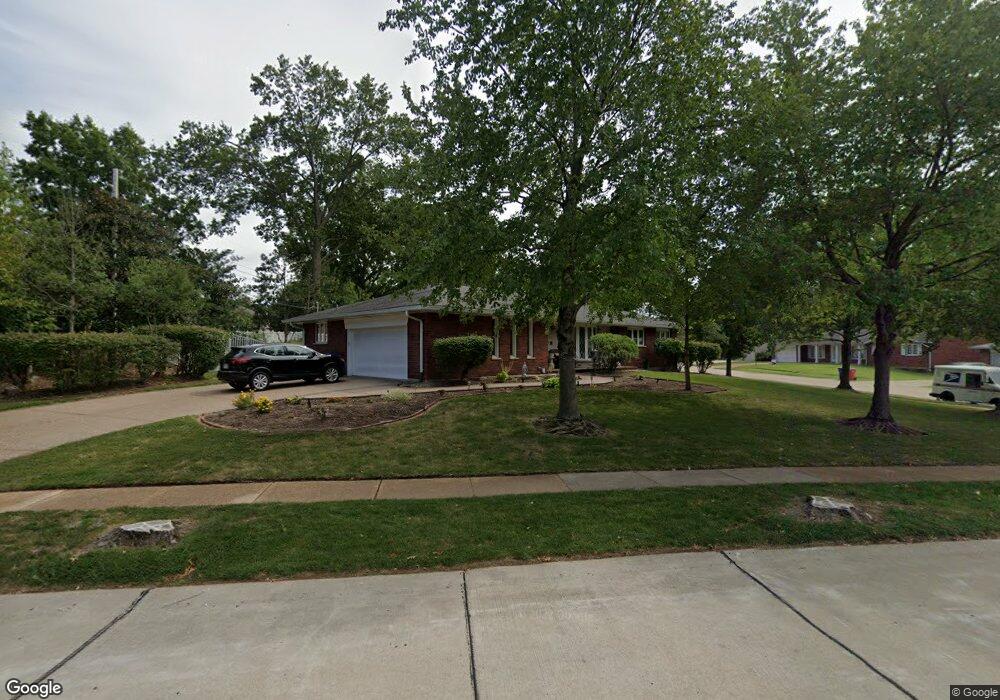
845 Barnsley Dr Saint Louis, MO 63125
Lemay NeighborhoodEstimated Value: $326,000 - $375,000
3
Beds
3
Baths
1,834
Sq Ft
$187/Sq Ft
Est. Value
About This Home
This home is located at 845 Barnsley Dr, Saint Louis, MO 63125 and is currently estimated at $343,628, approximately $187 per square foot. 845 Barnsley Dr is a home located in St. Louis County with nearby schools including Forder Elementary School, Margaret Buerkle Middle School, and Mehlville High School.
Ownership History
Date
Name
Owned For
Owner Type
Purchase Details
Closed on
Feb 10, 2022
Sold by
Teepe Robert J and Joint Vickie
Bought by
Meyer William A and Meyer Jennifer L
Current Estimated Value
Purchase Details
Closed on
Sep 5, 2008
Sold by
Teepe Robert and Teepe Vickie
Bought by
Teepe Robert and Teepe Vickie
Purchase Details
Closed on
Jul 2, 2007
Sold by
Kenneth G Chettle Jr Family Trust
Bought by
Teepe Robert and Leahart Vickie
Home Financials for this Owner
Home Financials are based on the most recent Mortgage that was taken out on this home.
Original Mortgage
$135,000
Interest Rate
6.41%
Mortgage Type
Purchase Money Mortgage
Purchase Details
Closed on
Jun 24, 2002
Sold by
Chettle Kenneth G and Chettle Marie D
Bought by
Chettle Kenneth G and Chettle Marie D
Purchase Details
Closed on
Jul 14, 1999
Sold by
Heggemeier Lester T and Heggemeier Geneva L
Bought by
Chettle Kenneth G and Chettle Marie D
Home Financials for this Owner
Home Financials are based on the most recent Mortgage that was taken out on this home.
Original Mortgage
$47,222
Interest Rate
7.39%
Create a Home Valuation Report for This Property
The Home Valuation Report is an in-depth analysis detailing your home's value as well as a comparison with similar homes in the area
Home Values in the Area
Average Home Value in this Area
Purchase History
| Date | Buyer | Sale Price | Title Company |
|---|---|---|---|
| Meyer William A | -- | Title Partners | |
| Teepe Robert | -- | Old Republic Company | |
| Teepe Robert | $235,000 | Ort | |
| Chettle Kenneth G | -- | -- | |
| Chettle Kenneth G | $224,900 | -- |
Source: Public Records
Mortgage History
| Date | Status | Borrower | Loan Amount |
|---|---|---|---|
| Previous Owner | Teepe Robert | $135,000 | |
| Previous Owner | Chettle Kenneth G | $47,222 |
Source: Public Records
Tax History Compared to Growth
Tax History
| Year | Tax Paid | Tax Assessment Tax Assessment Total Assessment is a certain percentage of the fair market value that is determined by local assessors to be the total taxable value of land and additions on the property. | Land | Improvement |
|---|---|---|---|---|
| 2025 | $3,700 | $57,800 | $19,650 | $38,150 |
| 2024 | $3,700 | $50,420 | $10,790 | $39,630 |
| 2023 | $3,485 | $50,420 | $10,790 | $39,630 |
| 2022 | $3,185 | $42,660 | $11,800 | $30,860 |
| 2021 | $2,923 | $42,660 | $11,800 | $30,860 |
| 2020 | $3,030 | $41,870 | $12,670 | $29,200 |
| 2019 | $3,022 | $41,870 | $12,670 | $29,200 |
| 2018 | $2,947 | $36,350 | $7,240 | $29,110 |
| 2017 | $2,939 | $36,350 | $7,240 | $29,110 |
| 2016 | $2,877 | $34,150 | $6,880 | $27,270 |
| 2015 | $2,711 | $34,150 | $6,880 | $27,270 |
| 2014 | $2,448 | $30,660 | $5,620 | $25,040 |
Source: Public Records
Map
Nearby Homes
- 669 Vista Conn Dr
- 645 Vista Conn Dr
- 2105 Telford Dr
- 2228 Hagenstone Terrace
- 502 Nannette Dr
- 333 Pentonville Dr
- 800 Dumont Place Unit B
- 1745 Herault Place Unit E
- 1725 Herault Place Unit G
- 1716 Mayenne Ct Unit E
- 1153 Calley Dr Unit 1153
- 317 Tacoma Dr
- 408 W Ripa Ave
- 824 Dumont Place Unit C
- 846 Dumont Place
- 600 Ellwine Dr
- 1275 Gardens Circle Dr Unit A
- 1678 Blue Ridge Dr Unit A
- 1677 Herault Place Unit B
- 1673 Herault Place Unit B
- 841 Barnsley Dr
- 2234 Telford Dr
- 720 Autumn Ridge Ct
- 2245 Telford Dr
- 2226 Telford Dr
- 2239 Telford Dr
- 846 Barnsley Dr
- 833 Barnsley Dr
- 2249 Telford Dr
- 716 Autumn Ridge Ct
- 842 Barnsley Dr
- 723 Autumn Ridge Ct
- 2227 Telford Dr
- 2218 Telford Dr
- 2301 Telford Dr
- 834 Barnsley Dr
- 827 Barnsley Dr
- 712 Autumn Ridge Ct
- 2210 Telford Dr
- 2307 Telford Dr