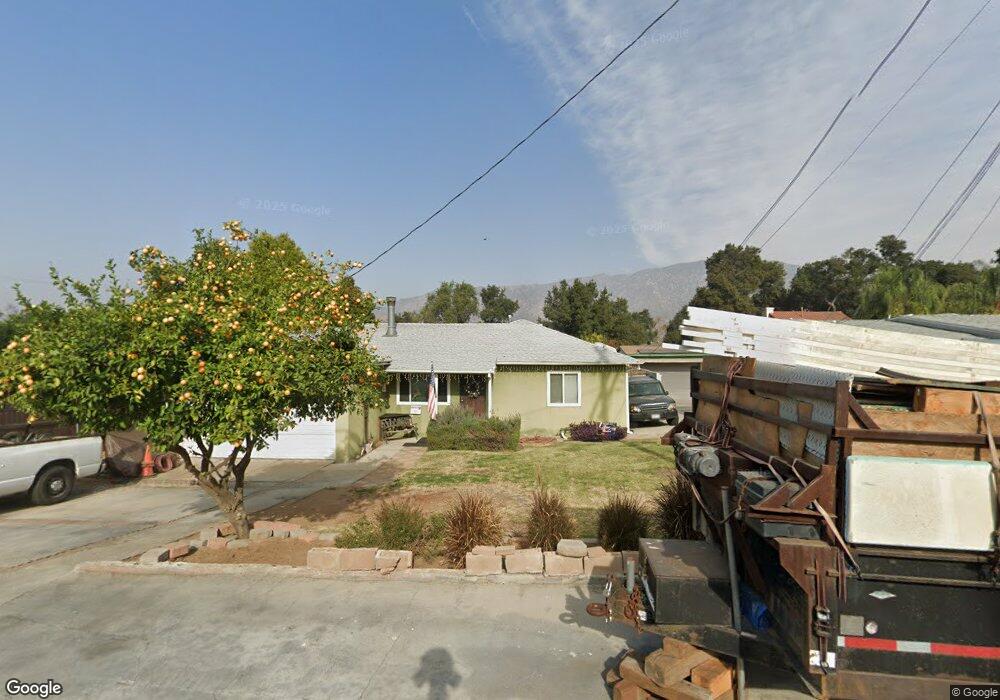
8453 Fenwick St Sunland, CA 91040
Sunland NeighborhoodEstimated Value: $816,685 - $1,001,000
3
Beds
2
Baths
1,575
Sq Ft
$561/Sq Ft
Est. Value
About This Home
This home is located at 8453 Fenwick St, Sunland, CA 91040 and is currently estimated at $883,421, approximately $560 per square foot. 8453 Fenwick St is a home located in Los Angeles County with nearby schools including Sunland Elementary School, Mt. Gleason Middle School, and Verdugo Hills Senior High School.
Ownership History
Date
Name
Owned For
Owner Type
Purchase Details
Closed on
Aug 10, 2000
Sold by
Deyoung James
Bought by
Nelson David and Nelson Terri
Current Estimated Value
Home Financials for this Owner
Home Financials are based on the most recent Mortgage that was taken out on this home.
Original Mortgage
$194,750
Outstanding Balance
$70,514
Interest Rate
8.2%
Estimated Equity
$812,907
Create a Home Valuation Report for This Property
The Home Valuation Report is an in-depth analysis detailing your home's value as well as a comparison with similar homes in the area
Home Values in the Area
Average Home Value in this Area
Purchase History
| Date | Buyer | Sale Price | Title Company |
|---|---|---|---|
| Nelson David | $205,000 | Southland Title Company |
Source: Public Records
Mortgage History
| Date | Status | Borrower | Loan Amount |
|---|---|---|---|
| Open | Nelson David | $194,750 |
Source: Public Records
Tax History Compared to Growth
Tax History
| Year | Tax Paid | Tax Assessment Tax Assessment Total Assessment is a certain percentage of the fair market value that is determined by local assessors to be the total taxable value of land and additions on the property. | Land | Improvement |
|---|---|---|---|---|
| 2025 | $3,909 | $308,878 | $200,548 | $108,330 |
| 2024 | $3,909 | $302,822 | $196,616 | $106,206 |
| 2023 | $3,837 | $296,885 | $192,761 | $104,124 |
| 2022 | $3,663 | $291,065 | $188,982 | $102,083 |
| 2021 | $3,615 | $285,359 | $185,277 | $100,082 |
| 2019 | $3,511 | $276,897 | $179,783 | $97,114 |
| 2018 | $3,412 | $271,468 | $176,258 | $95,210 |
| 2016 | $3,253 | $260,928 | $169,414 | $91,514 |
| 2015 | $3,207 | $257,010 | $166,870 | $90,140 |
| 2014 | $3,226 | $251,977 | $163,602 | $88,375 |
Source: Public Records
Map
Nearby Homes
- 8421 Grenoble St
- 10704 Oro Vista Ave
- 10711 Sherman Grove Ave Unit 26
- 10711 Sherman Grove Ave Unit 13
- 10711 Sherman Grove Ave Unit 36
- 10799 Sherman Grove Ave
- 10799 Sherman Grove Ave Unit 18
- 10799 Sherman Grove Ave Unit 61
- 8352 Wyngate St
- 8230 Hillrose St
- 10335 Oro Vista Ave
- 8545 Forsythe St
- 10347 Newhome Ave
- 8720 Mulberry Dr
- 10429 Mcvine Ave
- 10415 Mcvine Ave Unit 2
- 10500 Sunland Blvd Unit 2
- 10435 Newhome Ave Unit 7
- 10504 Sunland Blvd Unit 5
- 10430 Mcvine Ave
- 8445 Fenwick St
- 8457 Fenwick St
- 10612 Floralita Ave
- 8441 Fenwick St
- 10620 Floralita Ave
- 8448 Fenwick St
- 8446 Fenwick St
- 8442 Oswego St
- 8433 Fenwick St
- 8505 Fenwick St
- 8442 Fenwick St
- 8456 Fenwick St Unit 8450 Fenwick
- 8436 Oswego St
- 10624 Floralita Ave
- 8438 Fenwick St
- 8434 Fenwick St
- 8427 Fenwick St
- 8432 Oswego St
- 8511 Fenwick St
- 8504 Fenwick St