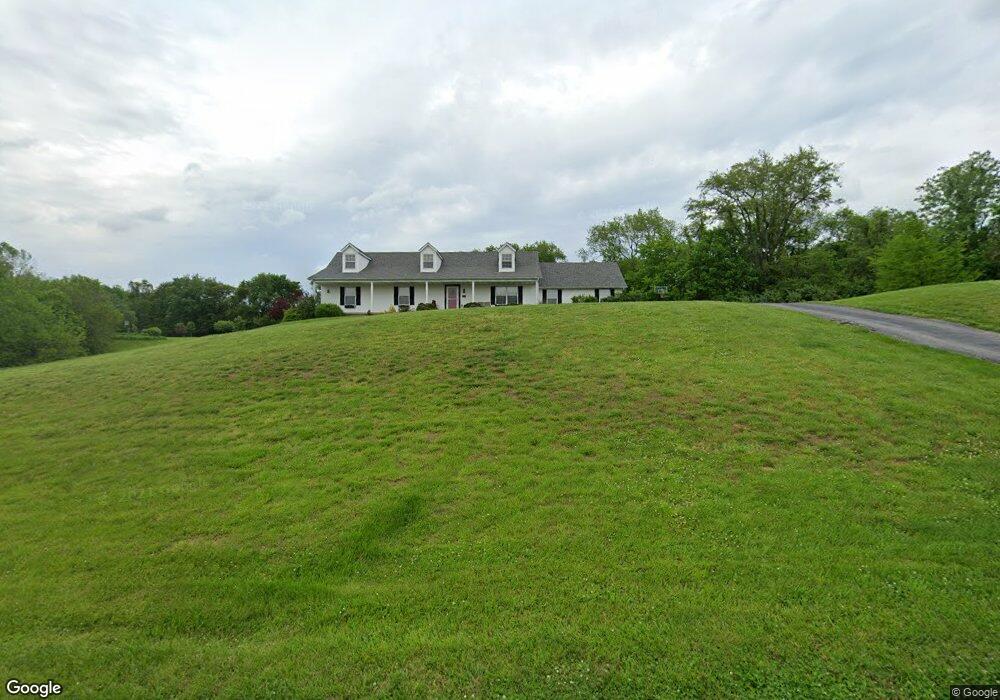
8468 Dupont Ln Belleville, IL 62223
Estimated Value: $403,000 - $565,000
--
Bed
--
Bath
1,888
Sq Ft
$242/Sq Ft
Est. Value
About This Home
This home is located at 8468 Dupont Ln, Belleville, IL 62223 and is currently estimated at $457,329, approximately $242 per square foot. 8468 Dupont Ln is a home located in St. Clair County with nearby schools including Millstadt Primary Center, Millstadt Consolidated School, and Our Lady Queen Of Peace Catholic School.
Ownership History
Date
Name
Owned For
Owner Type
Purchase Details
Closed on
Jan 31, 2014
Sold by
Baack Darrin and Baack Jessica
Bought by
Tenancy Darrin A and Tenancy Jessica K Baack Joint
Current Estimated Value
Purchase Details
Closed on
May 31, 2007
Sold by
Loeffler Dustin and Loeffler Amanda
Bought by
Baack Darrin and Baack Jessica
Home Financials for this Owner
Home Financials are based on the most recent Mortgage that was taken out on this home.
Original Mortgage
$228,000
Outstanding Balance
$139,588
Interest Rate
6.2%
Mortgage Type
Purchase Money Mortgage
Estimated Equity
$317,742
Purchase Details
Closed on
Oct 29, 2004
Sold by
Lauth Gail M
Bought by
Loeffler Dustin
Purchase Details
Closed on
Apr 15, 2004
Sold by
Dosier Jeff N and Dosier Heidi M
Bought by
Loeffler Dustin and Lauth Gail M
Home Financials for this Owner
Home Financials are based on the most recent Mortgage that was taken out on this home.
Original Mortgage
$223,250
Interest Rate
5.66%
Mortgage Type
Purchase Money Mortgage
Create a Home Valuation Report for This Property
The Home Valuation Report is an in-depth analysis detailing your home's value as well as a comparison with similar homes in the area
Home Values in the Area
Average Home Value in this Area
Purchase History
| Date | Buyer | Sale Price | Title Company |
|---|---|---|---|
| Tenancy Darrin A | -- | None Available | |
| Baack Darrin | $285,000 | Fatic | |
| Loeffler Dustin | -- | First Am Title Midwest Title | |
| Loeffler Dustin | $235,000 | First Am Title Midwest Title |
Source: Public Records
Mortgage History
| Date | Status | Borrower | Loan Amount |
|---|---|---|---|
| Open | Baack Darrin | $228,000 | |
| Previous Owner | Loeffler Dustin | $223,250 |
Source: Public Records
Tax History Compared to Growth
Tax History
| Year | Tax Paid | Tax Assessment Tax Assessment Total Assessment is a certain percentage of the fair market value that is determined by local assessors to be the total taxable value of land and additions on the property. | Land | Improvement |
|---|---|---|---|---|
| 2024 | $9,247 | $115,772 | $23,487 | $92,285 |
| 2023 | $8,598 | $103,878 | $21,074 | $82,804 |
| 2022 | $8,128 | $94,263 | $19,123 | $75,140 |
| 2021 | $7,805 | $87,515 | $17,754 | $69,761 |
| 2020 | $7,288 | $79,546 | $17,272 | $62,274 |
| 2019 | $7,279 | $79,546 | $17,272 | $62,274 |
| 2018 | $7,030 | $76,012 | $16,505 | $59,507 |
| 2017 | $6,337 | $70,792 | $15,372 | $55,420 |
| 2016 | $6,097 | $68,167 | $14,603 | $53,564 |
| 2014 | $5,545 | $68,558 | $14,687 | $53,871 |
| 2013 | $4,913 | $73,144 | $15,669 | $57,475 |
Source: Public Records
Map
Nearby Homes
- 107 Howard Dr
- 510 Fern Dr
- 636 Fern Dr
- 512 Belvedere Dr
- 400 Conniston Dr
- 109 Cascade Dr
- 517 Belvedere Dr
- 100 Cascade Dr
- 631 Monica Dr
- 632 Fern Dr
- 8100 Excellence Place
- 109 Eiler Rd
- 29 Cat Tail Ct
- 621 Eiler Rd
- 967 Hidden Cove
- 613 Sunnyhill Dr
- 8310 Old Saint Louis Rd
- 2 Dottie Dr
- 57 Cheshire Dr
- 1210 Express Dr