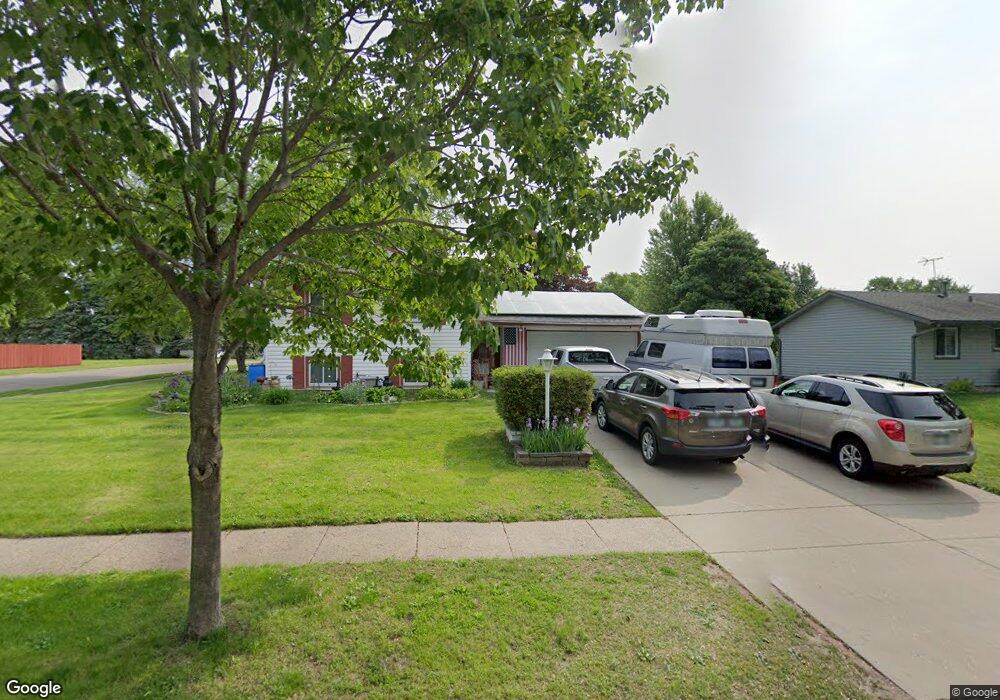
849 Oriole Dr Saint Paul, MN 55124
Old Town NeighborhoodEstimated Value: $343,673 - $393,000
4
Beds
2
Baths
862
Sq Ft
$423/Sq Ft
Est. Value
About This Home
This home is located at 849 Oriole Dr, Saint Paul, MN 55124 and is currently estimated at $364,918, approximately $423 per square foot. 849 Oriole Dr is a home located in Dakota County with nearby schools including Cedar Park Elementary STEM School, Valley Middle School, and Apple Valley Senior High School.
Ownership History
Date
Name
Owned For
Owner Type
Purchase Details
Closed on
Jun 10, 2022
Sold by
Lake Joseph
Bought by
Gunderson Andrew and Messenger Emily
Current Estimated Value
Home Financials for this Owner
Home Financials are based on the most recent Mortgage that was taken out on this home.
Original Mortgage
$248,000
Outstanding Balance
$235,621
Interest Rate
5.1%
Mortgage Type
New Conventional
Estimated Equity
$129,298
Purchase Details
Closed on
Oct 10, 2019
Sold by
Lake Bernard A and Buls Lake Doris A
Bought by
Lake Joseph D
Home Financials for this Owner
Home Financials are based on the most recent Mortgage that was taken out on this home.
Original Mortgage
$228,000
Interest Rate
3.4%
Mortgage Type
New Conventional
Purchase Details
Closed on
Aug 9, 2011
Sold by
Moulder Elizabeth I
Bought by
Moulder Elizabeth I and The Elizabeth I Moulder Trust
Create a Home Valuation Report for This Property
The Home Valuation Report is an in-depth analysis detailing your home's value as well as a comparison with similar homes in the area
Home Values in the Area
Average Home Value in this Area
Purchase History
| Date | Buyer | Sale Price | Title Company |
|---|---|---|---|
| Gunderson Andrew | $310,000 | -- | |
| Lake Joseph D | $270,000 | On Site Title | |
| Moulder Elizabeth I | -- | None Available |
Source: Public Records
Mortgage History
| Date | Status | Borrower | Loan Amount |
|---|---|---|---|
| Open | Gunderson Andrew | $248,000 | |
| Previous Owner | Lake Joseph D | $228,000 |
Source: Public Records
Tax History Compared to Growth
Tax History
| Year | Tax Paid | Tax Assessment Tax Assessment Total Assessment is a certain percentage of the fair market value that is determined by local assessors to be the total taxable value of land and additions on the property. | Land | Improvement |
|---|---|---|---|---|
| 2024 | $3,300 | $298,700 | $82,900 | $215,800 |
| 2023 | $3,300 | $298,900 | $83,100 | $215,800 |
| 2022 | $2,832 | $298,700 | $82,800 | $215,900 |
| 2021 | $2,666 | $254,200 | $72,100 | $182,100 |
| 2020 | $2,668 | $236,000 | $68,600 | $167,400 |
| 2019 | $2,317 | $229,600 | $65,400 | $164,200 |
| 2018 | $2,222 | $211,400 | $62,200 | $149,200 |
| 2017 | $2,237 | $196,000 | $59,300 | $136,700 |
| 2016 | $2,218 | $188,300 | $56,500 | $131,800 |
| 2015 | $2,151 | $164,519 | $49,240 | $115,279 |
| 2014 | -- | $160,704 | $47,167 | $113,537 |
| 2013 | -- | $146,316 | $42,835 | $103,481 |
Source: Public Records
Map
Nearby Homes
- 841 Cortland Dr
- 834 Fireside Dr
- 889 Whitney Dr
- 921 Cortland Dr S
- 892 Redwell Ln
- 15722 Griffon Ct
- 7765 157th St W
- 7616 157th St W Unit D
- 14786 Hallmark Dr
- 14825 Haven Dr
- 7600 157th St W Unit 105
- 8090 159th St W
- 15887 Griffon Path
- 15979 Harwell Ave
- 15503 Gateway Path Unit 128
- 15511 Gateway Path Unit 132
- 15813 Garden View Dr
- 16096 Harmony Path
- 249 Elm Dr
- 15567 Garnet Way Unit 63