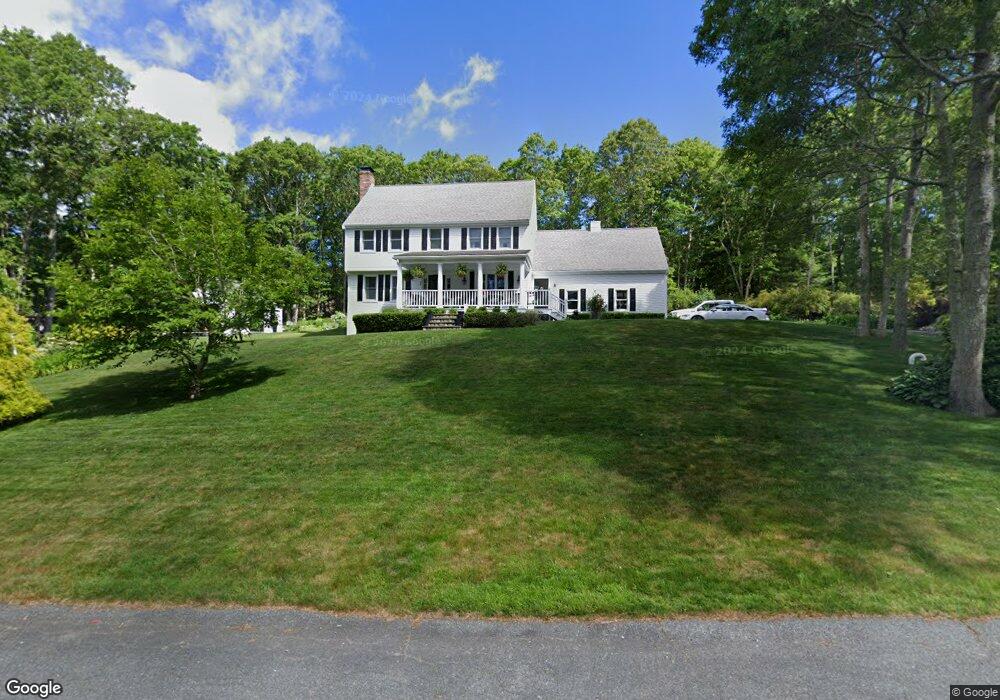
85 Allan Rd West Barnstable, MA 02668
West Barnstable NeighborhoodEstimated Value: $768,883 - $909,000
3
Beds
3
Baths
2,242
Sq Ft
$381/Sq Ft
Est. Value
About This Home
This home is located at 85 Allan Rd, West Barnstable, MA 02668 and is currently estimated at $854,221, approximately $381 per square foot. 85 Allan Rd is a home located in Barnstable County with nearby schools including Barnstable United Elementary School, West Barnstable Elementary School, and Barnstable Intermediate School.
Ownership History
Date
Name
Owned For
Owner Type
Purchase Details
Closed on
Feb 16, 1989
Sold by
Liimatainen David
Bought by
Liimatainen David
Current Estimated Value
Purchase Details
Closed on
Apr 1, 1987
Sold by
Mckeon John C
Bought by
Leimatainer David
Create a Home Valuation Report for This Property
The Home Valuation Report is an in-depth analysis detailing your home's value as well as a comparison with similar homes in the area
Home Values in the Area
Average Home Value in this Area
Purchase History
| Date | Buyer | Sale Price | Title Company |
|---|---|---|---|
| Liimatainen David | $14,430 | -- | |
| Leimatainer David | $224,000 | -- |
Source: Public Records
Mortgage History
| Date | Status | Borrower | Loan Amount |
|---|---|---|---|
| Open | Leimatainer David | $200,000 | |
| Closed | Leimatainer David | $192,000 | |
| Closed | Leimatainer David | $55,000 |
Source: Public Records
Tax History Compared to Growth
Tax History
| Year | Tax Paid | Tax Assessment Tax Assessment Total Assessment is a certain percentage of the fair market value that is determined by local assessors to be the total taxable value of land and additions on the property. | Land | Improvement |
|---|---|---|---|---|
| 2025 | $6,040 | $746,600 | $177,300 | $569,300 |
| 2024 | $5,540 | $709,400 | $177,300 | $532,100 |
| 2023 | $5,162 | $619,000 | $161,300 | $457,700 |
| 2022 | $4,851 | $503,200 | $119,800 | $383,400 |
| 2021 | $4,972 | $474,000 | $119,800 | $354,200 |
| 2020 | $4,844 | $442,000 | $127,500 | $314,500 |
| 2019 | $4,724 | $418,800 | $127,500 | $291,300 |
| 2018 | $4,369 | $389,400 | $134,200 | $255,200 |
| 2017 | $4,110 | $382,000 | $134,200 | $247,800 |
| 2016 | $4,197 | $385,000 | $137,200 | $247,800 |
| 2015 | $4,048 | $373,100 | $129,600 | $243,500 |
Source: Public Records
Map
Nearby Homes