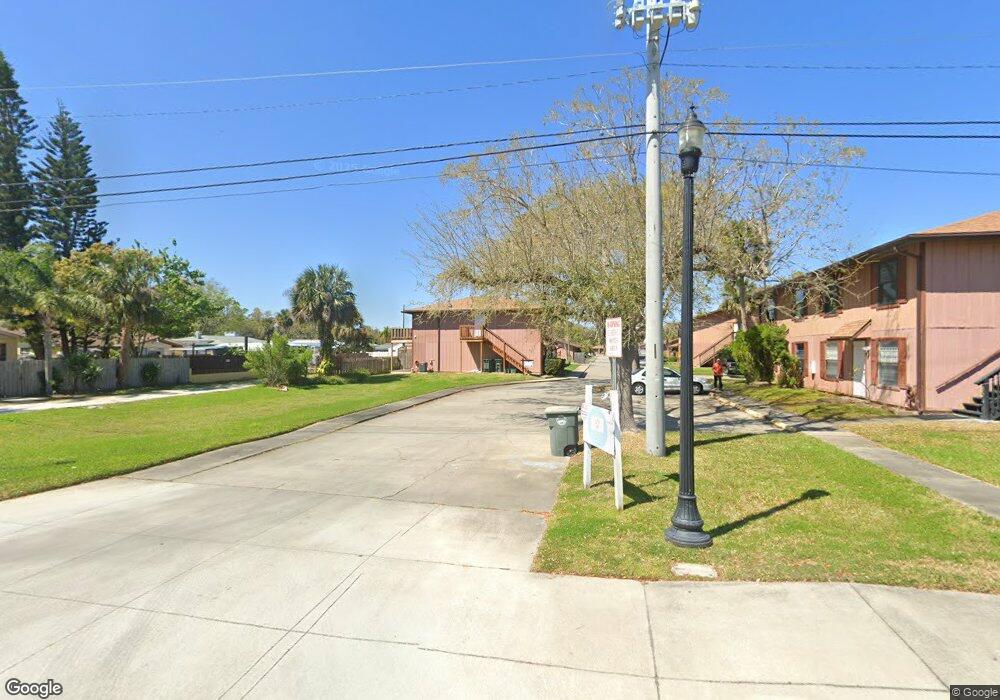
85 Fremont Ave Unit 5030 Daytona Beach, FL 32114
Central Daytona NeighborhoodEstimated Value: $116,000 - $152,000
2
Beds
2
Baths
1,068
Sq Ft
$123/Sq Ft
Est. Value
About This Home
This home is located at 85 Fremont Ave Unit 5030, Daytona Beach, FL 32114 and is currently estimated at $131,507, approximately $123 per square foot. 85 Fremont Ave Unit 5030 is a home located in Volusia County with nearby schools including Turie T. Small Elementary School, Campbell Middle School, and Mainland High School.
Ownership History
Date
Name
Owned For
Owner Type
Purchase Details
Closed on
Oct 11, 2022
Sold by
Griggs Andrew Calvin and Griggs Amanda Brock
Bought by
Patricia Sawyer Burton Revocable Trust
Current Estimated Value
Purchase Details
Closed on
Sep 18, 2017
Sold by
Jenmkins Malcalm K
Bought by
Griggs Andrew Calvin and Griggs Amanda Brock
Purchase Details
Closed on
Oct 19, 2016
Sold by
Halcomb Deborah K and Johnson Dennis A
Bought by
Jenkins Malcolm K
Purchase Details
Closed on
Aug 19, 2014
Sold by
Hurley Kathy and Hurley Kathy L
Bought by
Halcomb Deborah K and Johnson Dennis A
Purchase Details
Closed on
Dec 18, 2013
Sold by
Hurley Essie and Hurley Essie B
Bought by
Hurley Kathy and Hurley Dr Kathy L
Purchase Details
Closed on
Feb 14, 2013
Sold by
Hurley Essie
Bought by
Hurley Kathy
Purchase Details
Closed on
Mar 15, 1990
Bought by
Halcomb Deborah K
Purchase Details
Closed on
Apr 15, 1986
Bought by
Halcomb Deborah K
Create a Home Valuation Report for This Property
The Home Valuation Report is an in-depth analysis detailing your home's value as well as a comparison with similar homes in the area
Home Values in the Area
Average Home Value in this Area
Purchase History
| Date | Buyer | Sale Price | Title Company |
|---|---|---|---|
| Patricia Sawyer Burton Revocable Trust | $143,000 | Southern Title Holdings | |
| Griggs Andrew Calvin | $66,400 | Southern Title Holding Co Ll | |
| Jenkins Malcolm K | $60,000 | Realty Pro Title | |
| Halcomb Deborah K | $59,000 | Professional Title Agency In | |
| Hurley Kathy | -- | Attorney | |
| Hurley Essie | -- | Attorney | |
| Hurley Kathy | -- | None Available | |
| Halcomb Deborah K | $100 | -- | |
| Halcomb Deborah K | $47,900 | -- |
Source: Public Records
Tax History Compared to Growth
Tax History
| Year | Tax Paid | Tax Assessment Tax Assessment Total Assessment is a certain percentage of the fair market value that is determined by local assessors to be the total taxable value of land and additions on the property. | Land | Improvement |
|---|---|---|---|---|
| 2025 | $1,968 | $121,277 | $27,600 | $93,677 |
| 2024 | $1,968 | $121,739 | $27,600 | $94,139 |
| 2023 | $1,968 | $109,748 | $27,600 | $82,148 |
| 2022 | $1,482 | $95,976 | $20,800 | $75,176 |
| 2021 | $1,348 | $72,657 | $15,600 | $57,057 |
| 2020 | $1,233 | $66,893 | $13,500 | $53,393 |
| 2019 | $1,113 | $56,598 | $12,400 | $44,198 |
| 2018 | $1,192 | $58,544 | $13,800 | $44,744 |
| 2017 | $421 | $44,853 | $0 | $0 |
| 2016 | $210 | $52,265 | $0 | $0 |
| 2015 | $598 | $51,902 | $0 | $0 |
| 2014 | $1,069 | $45,295 | $0 | $0 |
Source: Public Records
Map
Nearby Homes
- 85 Fremont Ave Unit 601
- 89 Fremont Ave Unit 704
- 830 S Beach St
- 832 S Palmetto Ave
- 121 Bellevue Ave
- 201 Hepburn St
- 901 S Ridgewood Ave
- 120 Bellevue Ave
- 943 S Ridgewood Ave
- 208 Bellevue Ave
- 717 S Beach St Unit 102-C
- 721 S Beach St Unit 205A
- 721 S Beach St Unit 214A
- 721 S Beach St Unit 215A
- 721 S Beach St Unit 217A
- 717 S Beach St Unit 311C
- 717 S Beach St Unit 205C
- 717 S Beach St
- 717 S Beach St Unit 207C
- 920 S Ridgewood Ave Unit 1
- 85 Fremont Ave Unit 503
- 85 Fremont Ave Unit 801
- 85 Fremont Ave Unit 202
- 85 Fremont Ave Unit 603
- 85 Fremont Ave Unit 502
- 85 Fremont Ave Unit 602
- 85 Fremont Ave
- 85 Fremont Ave Unit 804
- 85 Fremont Ave Unit 8030
- 85 Fremont Ave Unit 8010
- 85 Fremont Ave Unit 7040
- 85 Fremont Ave Unit 7020
- 85 Fremont Ave Unit 7010
- 85 Fremont Ave Unit 6040
- 85 Fremont Ave Unit 6030
- 85 Fremont Ave Unit 6020
- 85 Fremont Ave Unit 6010
- 85 Fremont Ave Unit 5040
- 85 Fremont Ave Unit 5020
- 85 Fremont Ave Unit 5010