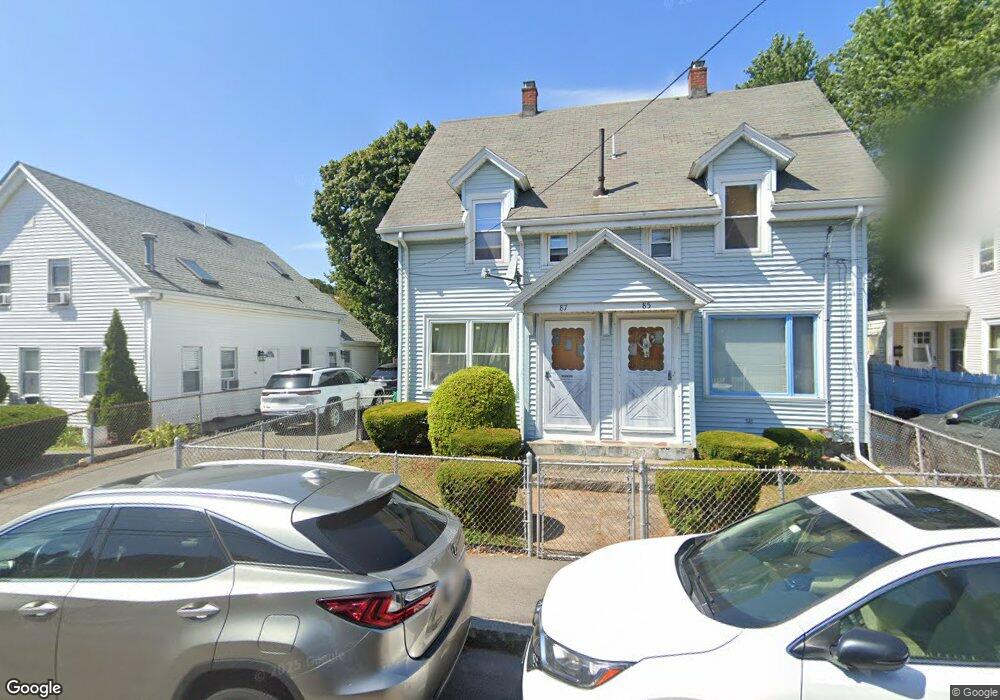
85 Garfield St Quincy, MA 02169
South Quincy NeighborhoodEstimated Value: $712,000 - $882,000
4
Beds
3
Baths
2,034
Sq Ft
$390/Sq Ft
Est. Value
About This Home
This home is located at 85 Garfield St, Quincy, MA 02169 and is currently estimated at $793,512, approximately $390 per square foot. 85 Garfield St is a home located in Norfolk County with nearby schools including Lincoln-Hancock Community School, South West Middle School, and Quincy High School.
Ownership History
Date
Name
Owned For
Owner Type
Purchase Details
Closed on
Jul 8, 2004
Sold by
Wu Xue Y
Bought by
Liang Shu C and Wu Xue Y
Current Estimated Value
Purchase Details
Closed on
Aug 28, 2001
Sold by
Fontaine Michael D
Bought by
Wu Xue Y
Home Financials for this Owner
Home Financials are based on the most recent Mortgage that was taken out on this home.
Original Mortgage
$280,000
Interest Rate
7.21%
Mortgage Type
Purchase Money Mortgage
Create a Home Valuation Report for This Property
The Home Valuation Report is an in-depth analysis detailing your home's value as well as a comparison with similar homes in the area
Home Values in the Area
Average Home Value in this Area
Purchase History
| Date | Buyer | Sale Price | Title Company |
|---|---|---|---|
| Liang Shu C | -- | -- | |
| Wu Xue Y | $312,000 | -- | |
| Fontaine Michael D | $60,000 | -- |
Source: Public Records
Mortgage History
| Date | Status | Borrower | Loan Amount |
|---|---|---|---|
| Previous Owner | Wu Xue Y | $280,000 |
Source: Public Records
Tax History Compared to Growth
Tax History
| Year | Tax Paid | Tax Assessment Tax Assessment Total Assessment is a certain percentage of the fair market value that is determined by local assessors to be the total taxable value of land and additions on the property. | Land | Improvement |
|---|---|---|---|---|
| 2025 | $7,654 | $663,800 | $275,300 | $388,500 |
| 2024 | $7,213 | $640,000 | $262,200 | $377,800 |
| 2023 | $6,858 | $616,200 | $238,400 | $377,800 |
| 2022 | $6,661 | $556,000 | $198,700 | $357,300 |
| 2021 | $6,331 | $521,500 | $198,700 | $322,800 |
| 2020 | $6,480 | $521,300 | $198,700 | $322,600 |
| 2019 | $5,764 | $459,300 | $187,400 | $271,900 |
| 2018 | $5,623 | $421,500 | $173,600 | $247,900 |
| 2017 | $5,794 | $408,900 | $165,300 | $243,600 |
| 2016 | $5,171 | $360,100 | $143,700 | $216,400 |
| 2015 | $5,085 | $348,300 | $143,700 | $204,600 |
| 2014 | $4,440 | $298,800 | $143,700 | $155,100 |
Source: Public Records
Map
Nearby Homes
- 91 Garfield St
- 64 Garfield St Unit B
- 21 Arthur St
- 12 Arthur Ave
- 14 Arthur Ave
- 46 Suomi Rd
- 46 Suomi Rd Unit 46
- 46-48 Buckley St
- 57 Buckley St
- 51 Brook Rd
- 94 Brook Rd Unit 3
- 76 Scotch Pond Place Unit 76
- 118 Brook Rd Unit 2
- 73 Scotch Pond Place
- 42 West St
- 1 Cityview Ln Unit 506
- 1 Cityview Ln Unit 210
- 1 Cityview Ln Unit 709
- 211 Copeland St
- 8 Jackson St Unit B2
- 81 Garfield St
- 23 Prout St
- 25 Prout St Unit 25
- 27 Prout St
- 90 Garfield St
- 84 Garfield St
- 77 Garfield St Unit 79
- 99 Garfield St
- 96 Garfield St
- 78 Garfield St
- 26 Prout St
- 22 Prout St
- 12 Prout St
- 108 Garfield St Unit A
- 108 Garfield St
- 30 Prout St
- 69 Garfield St
- 69 Garfield St Unit TH
- 75 Smith St
- 363 Granite St