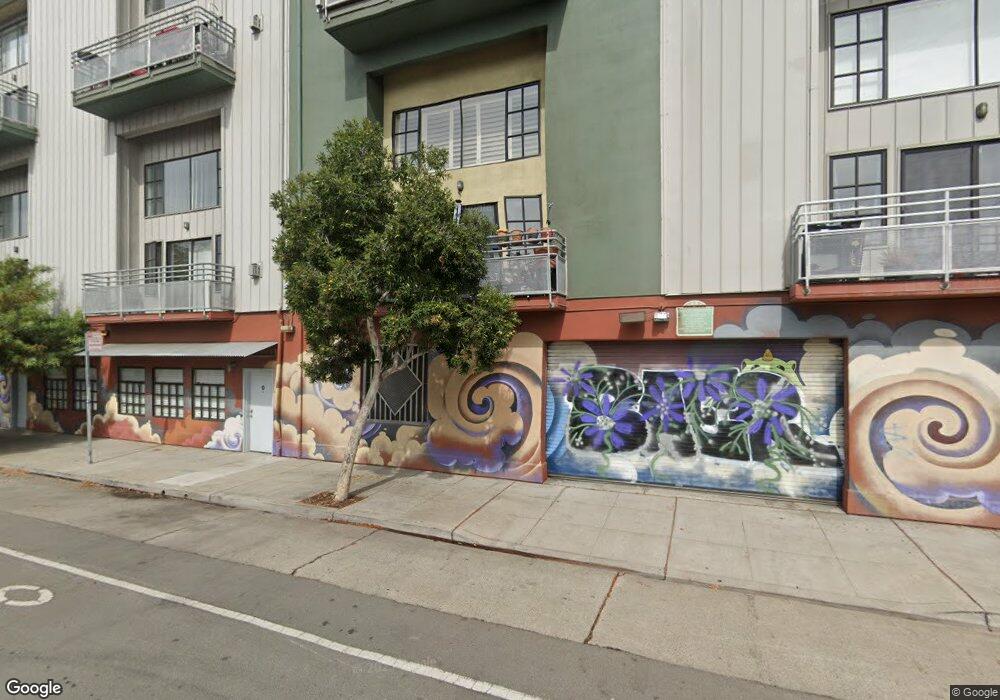
850 W Grand Ave Unit 10 Oakland, CA 94607
West Oakland NeighborhoodEstimated Value: $295,000 - $459,000
1
Bed
2
Baths
1,036
Sq Ft
$380/Sq Ft
Est. Value
About This Home
This home is located at 850 W Grand Ave Unit 10, Oakland, CA 94607 and is currently estimated at $393,634, approximately $379 per square foot. 850 W Grand Ave Unit 10 is a home located in Alameda County with nearby schools including M. L. King Jr. Elementary School, West Oakland Middle School, and McClymonds High School.
Ownership History
Date
Name
Owned For
Owner Type
Purchase Details
Closed on
Apr 25, 2012
Sold by
Orchard Terrace Estates Llc
Bought by
Stephenson Brett
Current Estimated Value
Purchase Details
Closed on
Mar 11, 2011
Sold by
Citimortgage Inc
Bought by
Orchard Terrace Estates Llc
Purchase Details
Closed on
Jul 21, 2010
Sold by
Chansy Tin V
Bought by
Citimortgage Inc
Purchase Details
Closed on
Feb 19, 2003
Sold by
West Grand Lofts Llc
Bought by
Chansy Tim V
Home Financials for this Owner
Home Financials are based on the most recent Mortgage that was taken out on this home.
Original Mortgage
$247,200
Interest Rate
6.75%
Mortgage Type
Purchase Money Mortgage
Create a Home Valuation Report for This Property
The Home Valuation Report is an in-depth analysis detailing your home's value as well as a comparison with similar homes in the area
Home Values in the Area
Average Home Value in this Area
Purchase History
| Date | Buyer | Sale Price | Title Company |
|---|---|---|---|
| Stephenson Brett | $95,500 | First American Title Company | |
| Orchard Terrace Estates Llc | $91,500 | None Available | |
| Citimortgage Inc | $162,750 | Cr Title Services Inc | |
| Chansy Tim V | $309,000 | First American Title Company |
Source: Public Records
Mortgage History
| Date | Status | Borrower | Loan Amount |
|---|---|---|---|
| Previous Owner | Chansy Tim V | $247,200 | |
| Closed | Chansy Tim V | $46,350 |
Source: Public Records
Tax History Compared to Growth
Tax History
| Year | Tax Paid | Tax Assessment Tax Assessment Total Assessment is a certain percentage of the fair market value that is determined by local assessors to be the total taxable value of land and additions on the property. | Land | Improvement |
|---|---|---|---|---|
| 2025 | $3,188 | $112,946 | $35,921 | $84,025 |
| 2024 | $3,188 | $110,595 | $35,217 | $82,378 |
| 2023 | $3,229 | $115,289 | $34,526 | $80,763 |
| 2022 | $3,074 | $106,029 | $33,849 | $79,180 |
| 2021 | $2,789 | $103,814 | $33,186 | $77,628 |
| 2020 | $2,755 | $109,678 | $32,846 | $76,832 |
| 2019 | $2,556 | $107,528 | $32,202 | $75,326 |
| 2018 | $2,504 | $105,421 | $31,571 | $73,850 |
| 2017 | $2,371 | $103,354 | $30,952 | $72,402 |
| 2016 | $2,201 | $101,327 | $30,345 | $70,982 |
| 2015 | $2,184 | $99,806 | $29,889 | $69,917 |
| 2014 | $2,098 | $97,851 | $29,304 | $68,547 |
Source: Public Records
Map
Nearby Homes
- 861 W Grand Ave
- 850 W Grand Ave Unit 6
- 881 21st St
- 845 Isabella St
- 878 Athens Ave
- 2112 West St Unit 2
- 2621 Market St
- 2327 San Pablo Ave
- 2311 San Pablo Ave
- 2103 Myrtle St
- 1915 West St
- 2521 San Pablo Ave
- 710 24th St
- 734 25th St
- 2505 Market St
- 2530 Market St
- 943 26th St
- 863 27th St
- 2625 San Pablo Ave
- 729 26th St
- 850 W Grand Ave Unit A
- 850 W Grand Ave
- 850 W Grand Ave
- 850 W Grand Ave
- 850 W Grand Ave Unit B
- 850 W Grand Ave Unit C
- 850 W Grand Ave Unit 4
- 850 W Grand Ave Unit 12
- 850 W Grand Ave Unit 1
- 850 W Grand Ave Unit 11
- 850 W Grand Ave Unit 13
- 850 W Grand Ave Unit 18
- 850 W Grand Ave Unit 9
- 850 W Grand Ave Unit 15
- 850 W Grand Ave Unit 17
- 850 W Grand Ave Unit 3
- 850 W Grand Ave Unit 7
- 850 W Grand Ave Unit 14
- 850 W Grand Ave Unit 19
- 850 W Grand Ave Unit 2