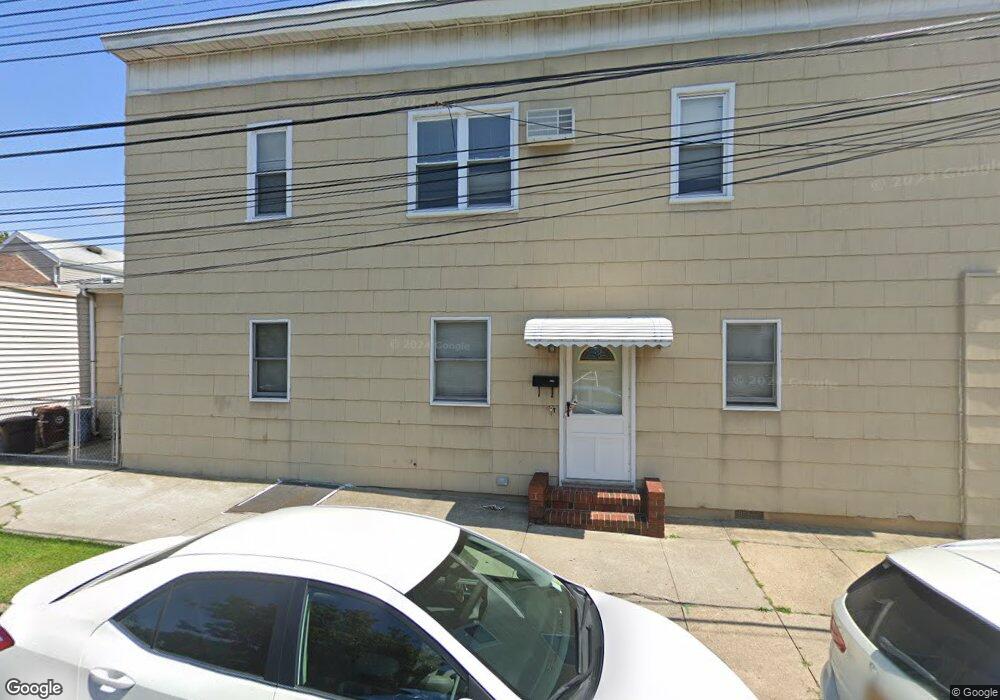
8501 95th Ave Ozone Park, NY 11416
Ozone Park NeighborhoodEstimated Value: $804,289 - $963,000
--
Bed
--
Bath
1,890
Sq Ft
$487/Sq Ft
Est. Value
About This Home
This home is located at 8501 95th Ave, Ozone Park, NY 11416 and is currently estimated at $919,572, approximately $486 per square foot. 8501 95th Ave is a home located in Queens County with nearby schools including New York City Academy For Discovery, Santiam Elementary School, and Jhs 210 Elizabeth Blackwell.
Ownership History
Date
Name
Owned For
Owner Type
Purchase Details
Closed on
Aug 29, 2022
Sold by
Khan Abdul and Khan Razid
Bought by
Khan Razid
Current Estimated Value
Purchase Details
Closed on
Aug 13, 2020
Sold by
Mario Maglione Estate
Bought by
Khan Abdul and Khan Razid
Home Financials for this Owner
Home Financials are based on the most recent Mortgage that was taken out on this home.
Original Mortgage
$883,698
Outstanding Balance
$778,862
Interest Rate
2.9%
Mortgage Type
Purchase Money Mortgage
Estimated Equity
$140,710
Create a Home Valuation Report for This Property
The Home Valuation Report is an in-depth analysis detailing your home's value as well as a comparison with similar homes in the area
Home Values in the Area
Average Home Value in this Area
Purchase History
| Date | Buyer | Sale Price | Title Company |
|---|---|---|---|
| Khan Razid | -- | -- | |
| Khan Razid | -- | -- | |
| Khan Razid | -- | -- | |
| Khan Abdul | $900,000 | -- | |
| Khan Abdul | $900,000 | -- | |
| Khan Abdul | $900,000 | -- |
Source: Public Records
Mortgage History
| Date | Status | Borrower | Loan Amount |
|---|---|---|---|
| Open | Khan Abdul | $883,698 | |
| Closed | Khan Abdul | $883,698 |
Source: Public Records
Tax History Compared to Growth
Tax History
| Year | Tax Paid | Tax Assessment Tax Assessment Total Assessment is a certain percentage of the fair market value that is determined by local assessors to be the total taxable value of land and additions on the property. | Land | Improvement |
|---|---|---|---|---|
| 2025 | $7,254 | $38,263 | $12,278 | $25,985 |
| 2024 | $7,254 | $36,116 | $11,706 | $24,410 |
| 2023 | $6,956 | $34,634 | $10,910 | $23,724 |
| 2022 | $6,813 | $47,220 | $15,480 | $31,740 |
| 2021 | $7,110 | $45,300 | $15,480 | $29,820 |
| 2020 | $6,040 | $49,800 | $15,480 | $34,320 |
| 2019 | $5,637 | $48,840 | $15,480 | $33,360 |
| 2018 | $5,225 | $28,862 | $12,642 | $16,220 |
| 2017 | $5,151 | $28,440 | $13,950 | $14,490 |
| 2016 | $2,756 | $28,440 | $13,950 | $14,490 |
| 2015 | $161 | $26,572 | $16,724 | $9,848 |
| 2014 | $161 | $25,081 | $16,397 | $8,684 |
Source: Public Records
Map
Nearby Homes