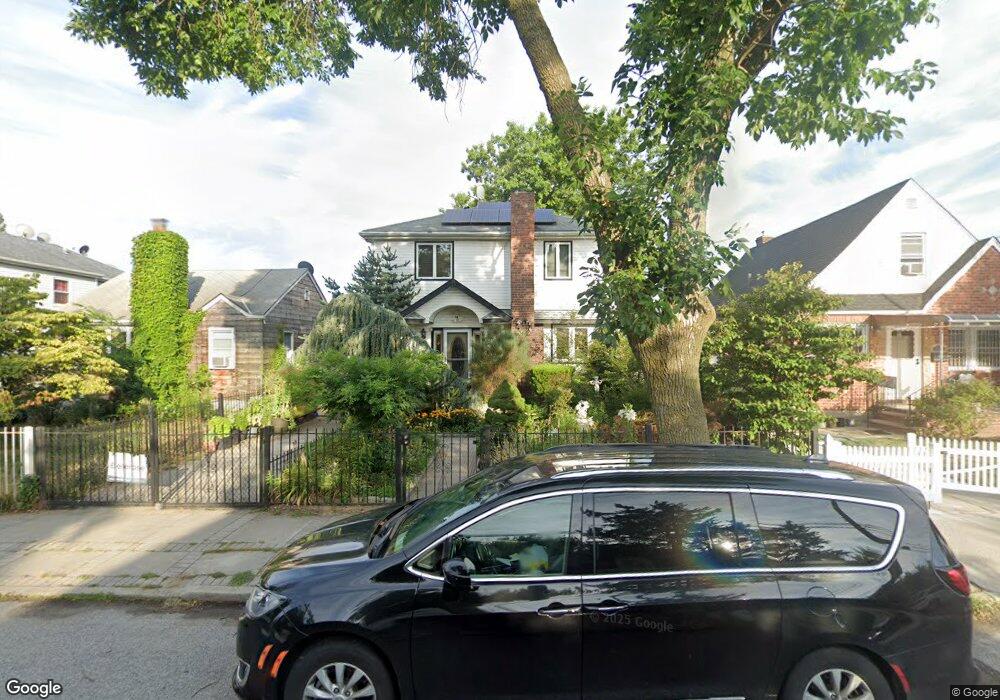
8506 241st St Bellerose, NY 11426
Bellerose NeighborhoodEstimated Value: $851,000 - $929,000
--
Bed
--
Bath
1,584
Sq Ft
$566/Sq Ft
Est. Value
About This Home
This home is located at 8506 241st St, Bellerose, NY 11426 and is currently estimated at $896,491, approximately $565 per square foot. 8506 241st St is a home located in Queens County with nearby schools including Fremont/Hay Elementary School, P.S. 18 Q The Winchester School, and Shasta Middle School.
Ownership History
Date
Name
Owned For
Owner Type
Purchase Details
Closed on
May 23, 2025
Sold by
Doreen Gebbia-Gross As Trustee and The Doreen Gebbia- Gross Revocable Trust
Bought by
Hossain Masuda P and Hossain Md S
Current Estimated Value
Home Financials for this Owner
Home Financials are based on the most recent Mortgage that was taken out on this home.
Original Mortgage
$720,000
Outstanding Balance
$716,286
Interest Rate
6.83%
Mortgage Type
Purchase Money Mortgage
Estimated Equity
$180,205
Purchase Details
Closed on
Jun 20, 2024
Sold by
Gebbia-Gross Doreen
Bought by
Doreen Gebbia-Gross Revocable Trust and Doreen Gebbia-Gross Trustee
Purchase Details
Closed on
Mar 29, 2013
Sold by
Gebbia Doreen
Bought by
Gebbia-Gross Doreen
Home Financials for this Owner
Home Financials are based on the most recent Mortgage that was taken out on this home.
Original Mortgage
$91,850
Interest Rate
3.52%
Mortgage Type
New Conventional
Create a Home Valuation Report for This Property
The Home Valuation Report is an in-depth analysis detailing your home's value as well as a comparison with similar homes in the area
Home Values in the Area
Average Home Value in this Area
Purchase History
| Date | Buyer | Sale Price | Title Company |
|---|---|---|---|
| Hossain Masuda P | $900,000 | -- | |
| Doreen Gebbia-Gross Revocable Trust | -- | -- | |
| Doreen Gebbia-Gross Revocable Trust | -- | -- | |
| Gebbia-Gross Doreen | -- | -- | |
| Gebbia-Gross Doreen | -- | -- |
Source: Public Records
Mortgage History
| Date | Status | Borrower | Loan Amount |
|---|---|---|---|
| Open | Hossain Masuda P | $720,000 | |
| Previous Owner | Gebbia-Gross Doreen | $91,850 |
Source: Public Records
Tax History Compared to Growth
Tax History
| Year | Tax Paid | Tax Assessment Tax Assessment Total Assessment is a certain percentage of the fair market value that is determined by local assessors to be the total taxable value of land and additions on the property. | Land | Improvement |
|---|---|---|---|---|
| 2025 | $8,263 | $45,092 | $12,254 | $32,838 |
| 2024 | $8,275 | $42,540 | $14,011 | $28,529 |
| 2023 | $7,867 | $40,570 | $11,237 | $29,333 |
| 2022 | $7,477 | $50,760 | $13,860 | $36,900 |
| 2021 | $7,759 | $42,960 | $13,860 | $29,100 |
| 2020 | $6,704 | $40,860 | $13,860 | $27,000 |
| 2019 | $6,183 | $40,020 | $13,860 | $26,160 |
| 2018 | $6,594 | $33,808 | $13,060 | $20,748 |
| 2017 | $6,202 | $31,896 | $11,530 | $20,366 |
| 2016 | $5,934 | $31,896 | $11,530 | $20,366 |
| 2015 | $3,629 | $31,574 | $11,986 | $19,588 |
| 2014 | $3,629 | $29,864 | $12,965 | $16,899 |
Source: Public Records
Map
Nearby Homes
- 23913 86th Ave
- 24125 85th Ave
- 241-10 86th Ave
- 24134 87th Ave
- 83-27 Commonwealth Blvd
- 24612 86th Rd
- 24607 87th Ave
- 8344 247th St
- 84-17 247th St
- 242-27 88th Dr
- 246-31 87th Ave
- 83-17 247th St
- 83-46 248th St
- 246-59 86th Rd
- 8860 240th St
- 87-01 Commonwealth Blvd
- 81-27 242nd St
- 246-62 87th Ave
- 88-19 247th St
- 82-08 247th St
- 8510 241st St
- 8502 241st St
- 8510 241st St
- 239-14 Hillside Ave
- 8514 241st St
- 23906 Hillside Ave
- 23910 Hillside Ave
- 8507 239th St
- 23914 Hillside Ave
- 23914 Hillside Ave Unit 1st Fl
- 85-11 239th St Unit 2nd Fl
- 85-11 239th St Unit 1st Fl
- 23914 Hillside Ave
- 239-6 Hillside Ave Unit 1
- 239-02 Hillside Ave
- 8511 239th St
- 23902 Hillside Ave
- 8518 241st St Unit 2nd Floor
- 8518 241st St
- 24102 85th Ave