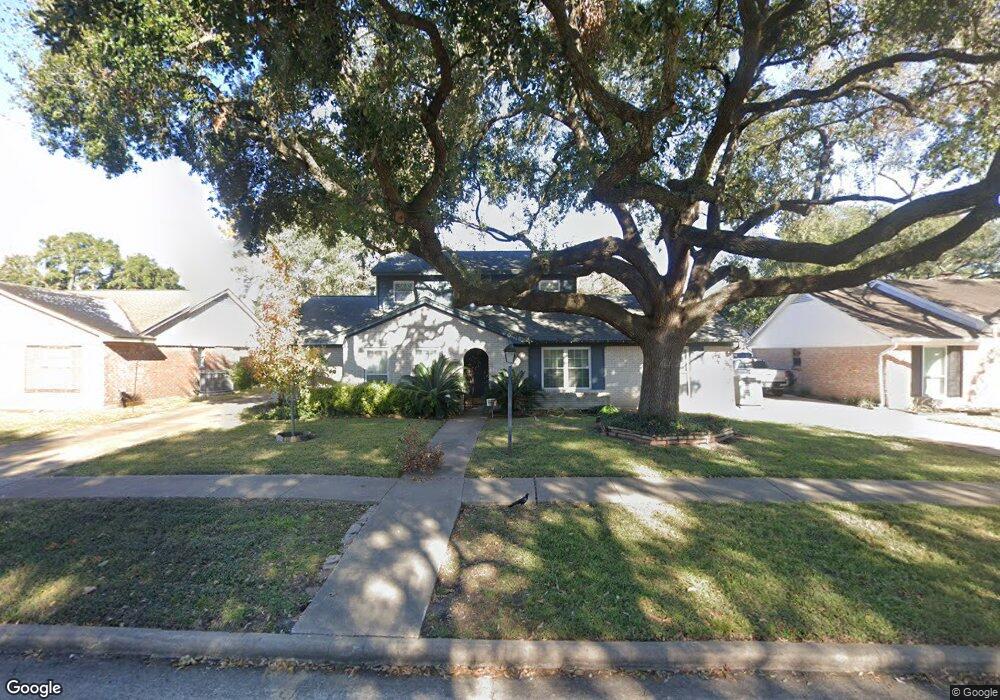
8506 Carvel Ln Houston, TX 77036
Sharpstown NeighborhoodEstimated Value: $315,952 - $341,000
4
Beds
2
Baths
2,260
Sq Ft
$146/Sq Ft
Est. Value
About This Home
This home is located at 8506 Carvel Ln, Houston, TX 77036 and is currently estimated at $330,988, approximately $146 per square foot. 8506 Carvel Ln is a home located in Harris County with nearby schools including Neff Elementary School, Sugar Grove Academy, and Sharpstown High School.
Ownership History
Date
Name
Owned For
Owner Type
Purchase Details
Closed on
Jul 23, 2010
Sold by
Lauckner Jason P
Bought by
Vu Truong X and Vu Vulan T
Current Estimated Value
Home Financials for this Owner
Home Financials are based on the most recent Mortgage that was taken out on this home.
Original Mortgage
$105,600
Interest Rate
4.76%
Mortgage Type
New Conventional
Purchase Details
Closed on
Oct 17, 2003
Sold by
Lauckner Maureen Murphy
Bought by
Lauckner Jason Paul
Purchase Details
Closed on
May 31, 1995
Sold by
Bilchak Joseph and Bilchak Emma
Bought by
Lauckner Jason P
Home Financials for this Owner
Home Financials are based on the most recent Mortgage that was taken out on this home.
Original Mortgage
$75,525
Interest Rate
8.2%
Purchase Details
Closed on
Apr 29, 1976
Sold by
Soler Rafael E and Soler Noemi
Bought by
Bilchak Joseph and Bilchak Emma
Home Financials for this Owner
Home Financials are based on the most recent Mortgage that was taken out on this home.
Original Mortgage
$31,500
Interest Rate
8.17%
Create a Home Valuation Report for This Property
The Home Valuation Report is an in-depth analysis detailing your home's value as well as a comparison with similar homes in the area
Home Values in the Area
Average Home Value in this Area
Purchase History
| Date | Buyer | Sale Price | Title Company |
|---|---|---|---|
| Vu Truong X | -- | Stewart Title Houston Div | |
| Lauckner Jason Paul | -- | -- | |
| Lauckner Jason P | -- | Commonwealth Land Title Co | |
| Bilchak Joseph | -- | Transamerica Title Co |
Source: Public Records
Mortgage History
| Date | Status | Borrower | Loan Amount |
|---|---|---|---|
| Closed | Vu Truong X | $105,600 | |
| Previous Owner | Lauckner Jason P | $75,525 | |
| Previous Owner | Bilchak Joseph | $31,500 |
Source: Public Records
Tax History Compared to Growth
Tax History
| Year | Tax Paid | Tax Assessment Tax Assessment Total Assessment is a certain percentage of the fair market value that is determined by local assessors to be the total taxable value of land and additions on the property. | Land | Improvement |
|---|---|---|---|---|
| 2025 | $3,475 | $244,000 | $135,599 | $108,401 |
| 2024 | $3,475 | $259,000 | $97,933 | $161,067 |
| 2023 | $3,475 | $278,070 | $97,933 | $180,137 |
| 2022 | $5,158 | $251,813 | $60,266 | $191,547 |
| 2021 | $4,789 | $205,472 | $60,266 | $145,206 |
| 2020 | $5,324 | $212,815 | $60,266 | $152,549 |
| 2019 | $5,454 | $208,916 | $45,200 | $163,716 |
| 2018 | $3,759 | $203,618 | $45,200 | $158,418 |
| 2017 | $4,733 | $185,000 | $45,200 | $139,800 |
| 2016 | $4,303 | $191,093 | $45,200 | $145,893 |
| 2015 | $2,639 | $171,544 | $45,200 | $126,344 |
| 2014 | $2,639 | $147,991 | $45,200 | $102,791 |
Source: Public Records
Map
Nearby Homes
- 7302 Burning Tree Dr
- 7302 Redding Rd
- 8418 Hazen St
- 8530 Roos Rd
- 7303 Augustine Dr
- 8218 Hazen St
- 8119 Concho St
- 8902 Langdon Ln
- 8818 Roos Rd
- 8923 Hendon Ln
- 8515 Edgemoor Dr
- 8826 Rowan Ln
- 8527 Edgemoor Dr
- 8019 Sharpview Dr
- 8314 Edgemoor Dr
- 9006 Roos Rd
- 8826 Tanager St
- 8222 La Roche Ln
- 8918 Grape St
- 9002 Grape St