Estimated Value: $572,000 - $626,000
4
Beds
3
Baths
2,000
Sq Ft
$298/Sq Ft
Est. Value
About This Home
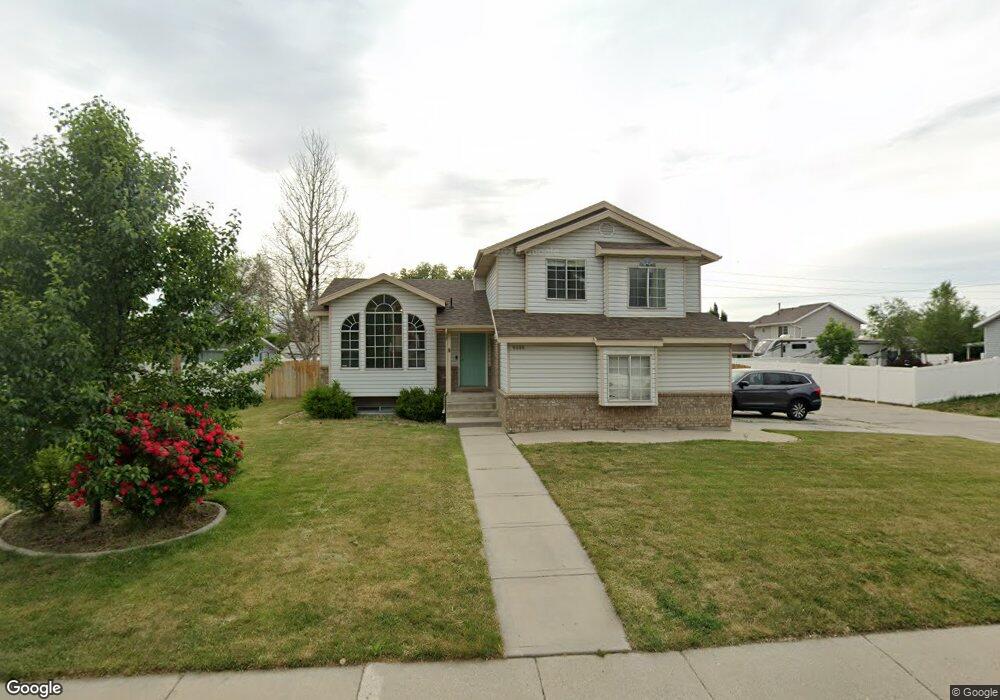
This home is located at 8508 S 300 E, Sandy, UT 84070 and is currently estimated at $596,555, approximately $298 per square foot. 8508 S 300 E is a home located in Salt Lake County with nearby schools including Sandy Elementary School, Mount Jordan Middle School, and Jordan High.
Ownership History
Date
Name
Owned For
Owner Type
Purchase Details
Closed on
Sep 8, 2020
Sold by
Williams Kyle Aaron and Williams Stacie Edman
Bought by
Gilbreath Houston and Huber Jessica
Current Estimated Value
Home Financials for this Owner
Home Financials are based on the most recent Mortgage that was taken out on this home.
Original Mortgage
$369,000
Outstanding Balance
$327,463
Interest Rate
2.9%
Mortgage Type
New Conventional
Estimated Equity
$269,092
Purchase Details
Closed on
Mar 27, 2017
Sold by
Allen Tyler J
Bought by
Williams Kyle Aaron and Williams Stacie Edman
Home Financials for this Owner
Home Financials are based on the most recent Mortgage that was taken out on this home.
Original Mortgage
$273,000
Interest Rate
4.15%
Mortgage Type
New Conventional
Purchase Details
Closed on
Sep 20, 2005
Sold by
Allen Tyler J
Bought by
Allen Tyler J
Home Financials for this Owner
Home Financials are based on the most recent Mortgage that was taken out on this home.
Original Mortgage
$138,100
Interest Rate
5.87%
Mortgage Type
New Conventional
Purchase Details
Closed on
Mar 5, 2004
Sold by
Allen Tyler and Allen Laree
Bought by
Allen Tyler J
Home Financials for this Owner
Home Financials are based on the most recent Mortgage that was taken out on this home.
Original Mortgage
$124,400
Interest Rate
3.88%
Mortgage Type
New Conventional
Purchase Details
Closed on
Sep 16, 2003
Sold by
Allen Tyler
Bought by
Allen Tyler and Allen Laree
Purchase Details
Closed on
Jul 25, 2002
Sold by
Chipman David
Bought by
Wells Fargo Bank Minnesota Na
Purchase Details
Closed on
May 6, 1998
Sold by
Chipman David M
Bought by
Chipman David
Home Financials for this Owner
Home Financials are based on the most recent Mortgage that was taken out on this home.
Original Mortgage
$170,000
Interest Rate
7.05%
Purchase Details
Closed on
Mar 19, 1996
Sold by
Chipman David
Bought by
Chipman David M and Chipman Franki
Home Financials for this Owner
Home Financials are based on the most recent Mortgage that was taken out on this home.
Original Mortgage
$138,550
Interest Rate
6.98%
Purchase Details
Closed on
Oct 27, 1994
Sold by
M N C Construction And Designers
Bought by
Chipman David and Husser Yvonne
Home Financials for this Owner
Home Financials are based on the most recent Mortgage that was taken out on this home.
Original Mortgage
$110,313
Interest Rate
8.7%
Create a Home Valuation Report for This Property
The Home Valuation Report is an in-depth analysis detailing your home's value as well as a comparison with similar homes in the area
Home Values in the Area
Average Home Value in this Area
Purchase History
| Date | Buyer | Sale Price | Title Company |
|---|---|---|---|
| Gilbreath Houston | -- | Cottonwood Title | |
| Williams Kyle Aaron | -- | United Title Services | |
| Allen Tyler J | -- | Independence Title | |
| Allen Tyler J | -- | Inwest Title Services | |
| Allen Tyler | -- | Inwest Title Services | |
| Allen Tyler | -- | Inwest Title Services | |
| Wells Fargo Bank Minnesota Na | $139,500 | American Preferred Title | |
| Chipman David | -- | -- | |
| Chipman David | -- | -- | |
| Chipman David M | -- | -- | |
| Chipman David M | -- | -- | |
| Chipman David M | -- | -- | |
| Chipman David | -- | -- | |
| M N C Construction And Designers | -- | -- |
Source: Public Records
Mortgage History
| Date | Status | Borrower | Loan Amount |
|---|---|---|---|
| Open | Gilbreath Houston | $369,000 | |
| Previous Owner | Williams Kyle Aaron | $273,000 | |
| Previous Owner | Allen Tyler J | $138,100 | |
| Previous Owner | Allen Tyler J | $124,400 | |
| Previous Owner | Chipman David M | $170,000 | |
| Previous Owner | Chipman David M | $138,550 | |
| Previous Owner | Chipman David | $110,313 |
Source: Public Records
Tax History Compared to Growth
Tax History
| Year | Tax Paid | Tax Assessment Tax Assessment Total Assessment is a certain percentage of the fair market value that is determined by local assessors to be the total taxable value of land and additions on the property. | Land | Improvement |
|---|---|---|---|---|
| 2025 | $3,037 | $605,100 | $130,000 | $475,100 |
| 2024 | $3,037 | $561,600 | $118,400 | $443,200 |
| 2023 | $2,728 | $503,000 | $112,500 | $390,500 |
| 2022 | $2,897 | $521,800 | $110,300 | $411,500 |
| 2021 | $2,787 | $427,400 | $86,300 | $341,100 |
| 2020 | $2,531 | $366,000 | $86,300 | $279,700 |
| 2019 | $2,497 | $351,900 | $86,300 | $265,600 |
| 2018 | $2,189 | $321,200 | $67,200 | $254,000 |
| 2017 | $1,978 | $277,200 | $62,200 | $215,000 |
| 2016 | $1,922 | $260,400 | $62,200 | $198,200 |
| 2015 | $2,011 | $252,100 | $63,400 | $188,700 |
| 2014 | $1,940 | $238,400 | $62,700 | $175,700 |
Source: Public Records
Map
Nearby Homes
- 283 E Pioneer Ave
- 8544 S 300 E
- 386 Pioneer Ave
- 354 E 8620 S
- 343 E 8680 S
- 149 E Pioneer Ave
- 547 E Pioneer Ave
- 8550 S 570 E
- 416 E 8260 S
- 139 E Abbeville Ct
- 144 E Chambord Ct
- 140 E Chambord Ct
- 56 Apollo Way
- 132 E Chambord Ct
- 110 E Main St
- 8322 S Levine Ln Unit 111
- 8772 S 120 E
- 8264 S Resaca Dr Unit K9
- 627 E 8680 S
- 21 E 8680 S
- 8480 S 300 E
- 8495 S 300 E
- 8514 S 300 E Unit 8516
- 8496 S 300 E
- 317 E Pioneer Ave
- 8505 S 300 E
- 317 Pioneer Ave
- 8485 S 300 E
- 8470 S 300 E
- 331 Pioneer Ave
- 290 E Pioneer Ave
- 8475 S 300 E
- 8493 S Handcart Way
- 8481 S Handcart Way
- 8460 S 300 E
- 330 E Old Sandy Ct
- 330 Old Sandy Ct
- 248 E Flicker Dr
- 251 E Pioneer Ave
- 251 Pioneer Ave