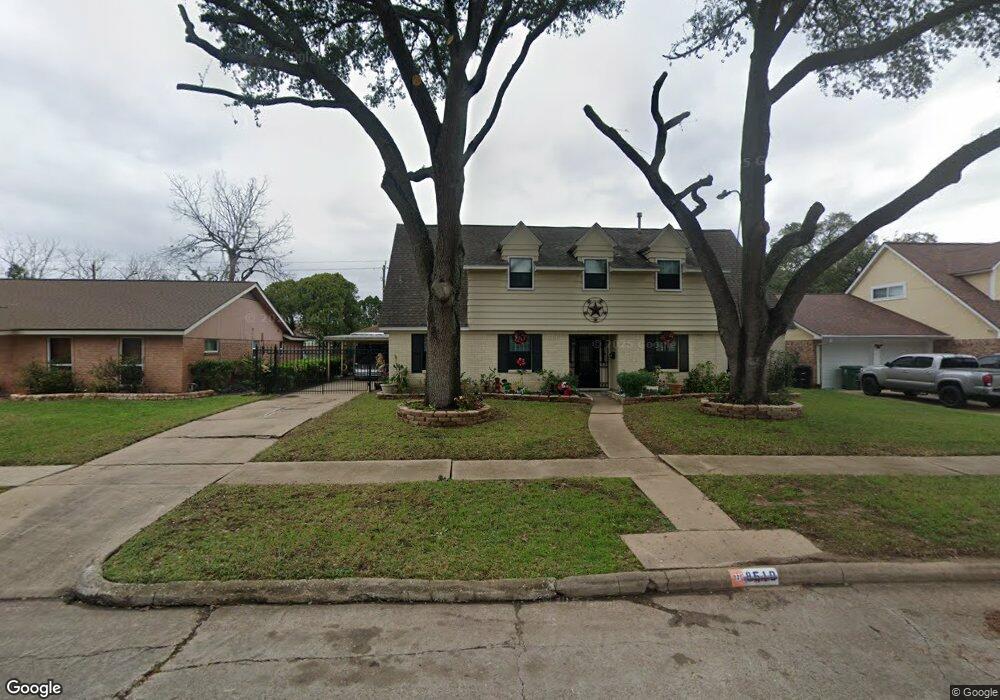
8510 Leader St Houston, TX 77036
Sharpstown NeighborhoodEstimated Value: $315,000 - $354,000
4
Beds
2
Baths
2,187
Sq Ft
$151/Sq Ft
Est. Value
About This Home
This home is located at 8510 Leader St, Houston, TX 77036 and is currently estimated at $330,735, approximately $151 per square foot. 8510 Leader St is a home located in Harris County with nearby schools including Neff Elementary School, Sugar Grove Academy, and Sharpstown High School.
Ownership History
Date
Name
Owned For
Owner Type
Purchase Details
Closed on
Feb 28, 2015
Sold by
Umana Santos and Umana Lesmeralda
Bought by
Ventura Maria G and Ventura Dolores
Current Estimated Value
Purchase Details
Closed on
Jul 22, 1999
Sold by
Zhu En Jun and He Xiang Min
Bought by
Ventura Dolores and Ventura Maria G
Home Financials for this Owner
Home Financials are based on the most recent Mortgage that was taken out on this home.
Original Mortgage
$93,522
Outstanding Balance
$26,341
Interest Rate
7.63%
Mortgage Type
Stand Alone First
Estimated Equity
$304,394
Purchase Details
Closed on
Mar 25, 1997
Sold by
Nutt Billie J
Bought by
Zhu En Jun and He Xiang Min
Home Financials for this Owner
Home Financials are based on the most recent Mortgage that was taken out on this home.
Original Mortgage
$59,500
Interest Rate
7.55%
Purchase Details
Closed on
Sep 14, 1994
Sold by
Nutt Billie Joe
Bought by
Nutt Billie Joe
Purchase Details
Closed on
Jun 29, 1994
Sold by
Klaftenegger Marcel I and Klaftenegger Brenda C
Bought by
Nutt Billie J
Create a Home Valuation Report for This Property
The Home Valuation Report is an in-depth analysis detailing your home's value as well as a comparison with similar homes in the area
Home Values in the Area
Average Home Value in this Area
Purchase History
| Date | Buyer | Sale Price | Title Company |
|---|---|---|---|
| Ventura Maria G | -- | None Available | |
| Ventura Dolores | -- | First American Title | |
| Zhu En Jun | -- | -- | |
| Nutt Billie Joe | -- | -- | |
| Nutt Billie J | -- | Texas American Title Co |
Source: Public Records
Mortgage History
| Date | Status | Borrower | Loan Amount |
|---|---|---|---|
| Open | Ventura Dolores | $93,522 | |
| Previous Owner | Zhu En Jun | $59,500 |
Source: Public Records
Tax History Compared to Growth
Tax History
| Year | Tax Paid | Tax Assessment Tax Assessment Total Assessment is a certain percentage of the fair market value that is determined by local assessors to be the total taxable value of land and additions on the property. | Land | Improvement |
|---|---|---|---|---|
| 2025 | $152 | $307,547 | $136,881 | $170,666 |
| 2024 | $152 | $314,429 | $98,859 | $215,570 |
| 2023 | $152 | $318,236 | $98,859 | $219,377 |
| 2022 | $5,959 | $289,436 | $60,836 | $228,600 |
| 2021 | $5,533 | $237,406 | $60,836 | $176,570 |
| 2020 | $5,677 | $226,953 | $60,836 | $166,117 |
| 2019 | $5,924 | $226,953 | $45,627 | $181,326 |
| 2018 | $1,355 | $217,755 | $45,627 | $172,128 |
| 2017 | $4,974 | $212,206 | $45,627 | $166,579 |
| 2016 | $5,325 | $204,149 | $45,627 | $158,522 |
| 2015 | $2,332 | $183,459 | $45,627 | $137,832 |
| 2014 | $2,332 | $158,314 | $45,627 | $112,687 |
Source: Public Records
Map
Nearby Homes
- 8515 Edgemoor Dr
- 8527 Edgemoor Dr
- 8314 Edgemoor Dr
- 8530 Roos Rd
- 7302 Redding Rd
- 7302 Burning Tree Dr
- 8826 Rowan Ln
- 8818 Roos Rd
- 7303 Augustine Dr
- 6411 Redding Rd
- 6602 Harbor Town Dr Unit 1207
- 6602 Harbor Town Dr Unit 1202
- 9006 Roos Rd
- 6500 Harbor Town Dr Unit 3208
- 6500 Harbor Town Dr Unit 2808
- 6500 Harbor Town Dr Unit 3204
- 6500 Harbor Town Dr Unit 3408
- 6500 Harbor Town Dr Unit 2902
- 7819 Bellaire Blvd
- 8019 Sharpview Dr
- 8514 Leader St
- 8506 Leader St
- 8511 Bellaire Blvd
- 8518 Leader St
- 8502 Leader St
- 8515 Bellaire Blvd
- 8507 Leader St
- 8503 Bellaire Blvd
- 8515 Leader St
- 8519 Bellaire Blvd
- 8522 Leader St
- 8519 Leader St
- 8427 Leader St
- 8523 Bellaire Blvd
- 8422 Leader St
- 8523 Leader St
- 8526 Leader St
- 8423 Leader St
- 8510 Edgemoor Dr
- 8506 Edgemoor Dr